

Here are the latest market charts and analysis for today. Check them out and know what’s happening in the market today.
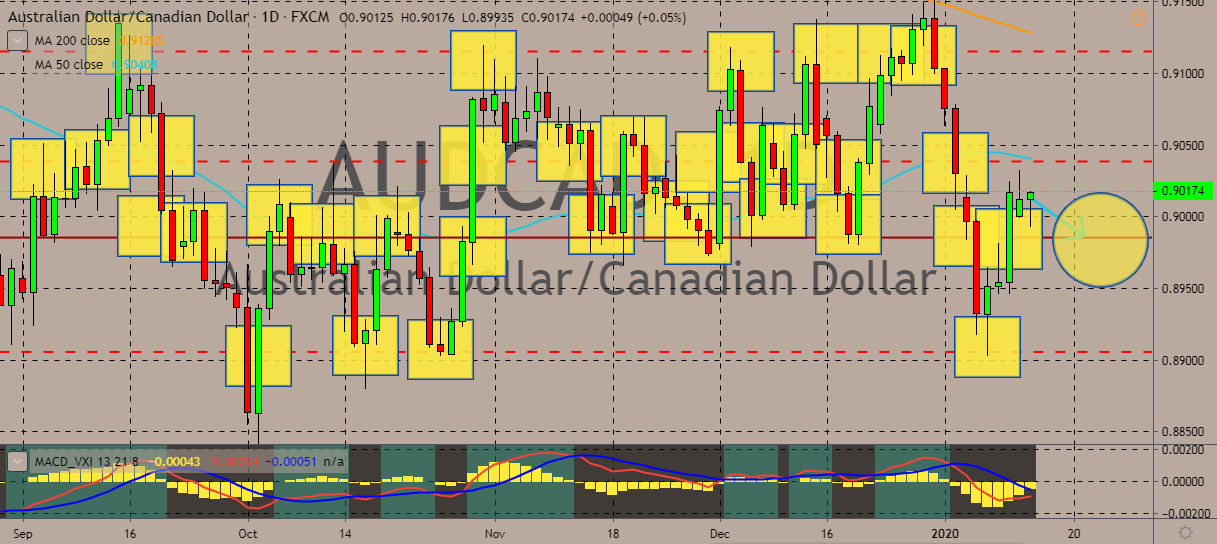
AUDCAD
The pair is currently trading in the red after moving steeply up in the previous sessions. The upward momentum, however, has apparently lost much of its steam. The price is still trading below the 50-day moving average, and if the price continues downward to October lows, the pair is set to continue its sideways chop in wide ranges. Over in Canada, businesses reported a slight increase in sentiment amid reduced concern about global trade conflict, showed a Bank of Canada survey. The survey of executives showed that indicators of future sales like new orders have risen, and there were also signs that businesses were running up against capacity. The composite gauge of sentiment increased to 0.74, which is the highest reading since the end of 2018. This is also the third straight quarter of improvement. Bank of Canada Governor Stephen Poloz puts weight on the survey, which he considers to be a critical supplement to harder economic data.
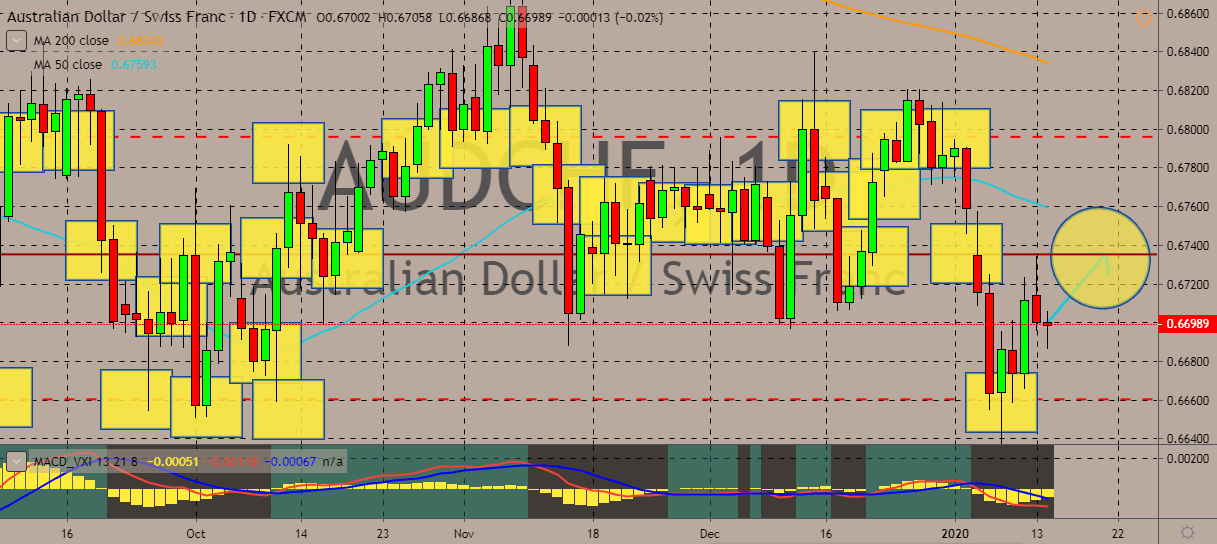
AUDCHF
The AUDCHF pair is gaining in sessions as the Australian dollar continues to gather tangential support from the US-China phase one trade deal, which is set to be signed on January 15, although the price still trades below the two moving averages, 50-day and 200-day, on the daily chart. Meanwhile, Switzerland’s financial sector continues to face pressure from climate activists and environmental supporters to divest from fossil fuels. Thousands of students have marched through Swiss cities in recent months, all demanding action on climate change. Just this week, a judge ruled the imminent danger posed by climate change meant activists weren’t guilty of trespassing when they occupied a Swiss bank to demand an end to funding of fossil fuel projects. According to Judge Philippe Colelough said that because insufficient measures, the average warming will increase. He said the activists’ actions were necessary to achieve the goals they sought.
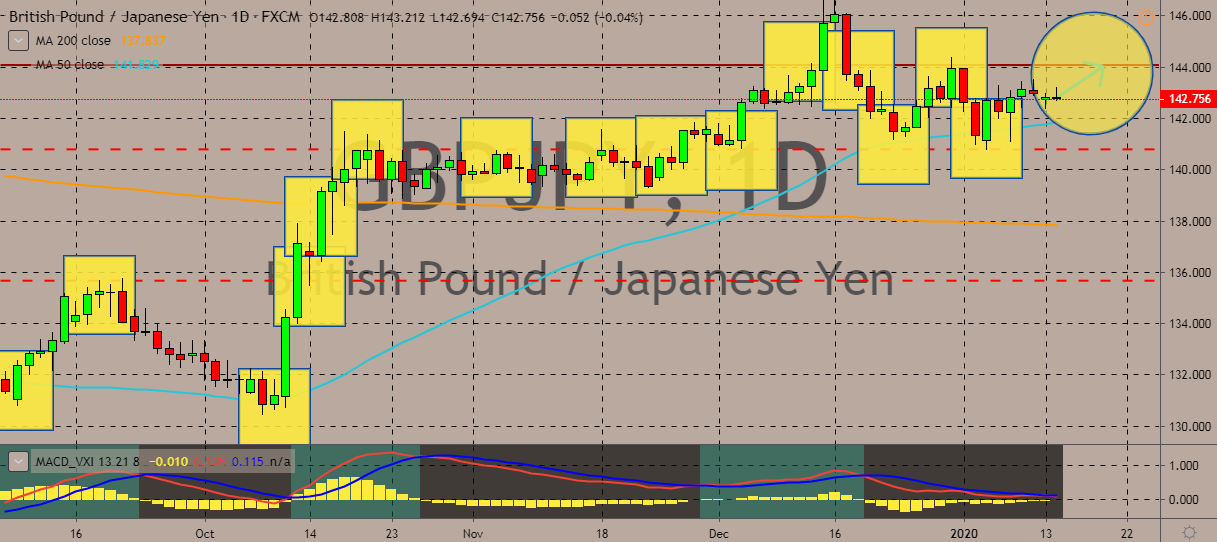
GBPJPY
The British pound has traded sideways against the yen in sessions, moving back and forth although maintaining a higher price than the 50-day and 200-day moving averages. Traders have been seeking clues and weighing whether the Bank of England would impose an interest rate cut at the end of the month with lacklustre GDP figures. BOE Monetary Policy Committee member Gertjan Vlieghe hinted that he could vote to cut rates if the upcoming data showed that the United Kingdom’s economy did not rebound. And on Monday, a string of data reinforced the concerns. The gross domestic product figures showed that Britain’s economy grew at its slowest pace in more than seven years. The November 2019 GDP was up just 0.6% compared to November 2018. Both the manufacturing output and industrial production both fell on an annualized basis. The BOE has not cut rates since 2016, being one of the few banks who’ve held rates in 2019.
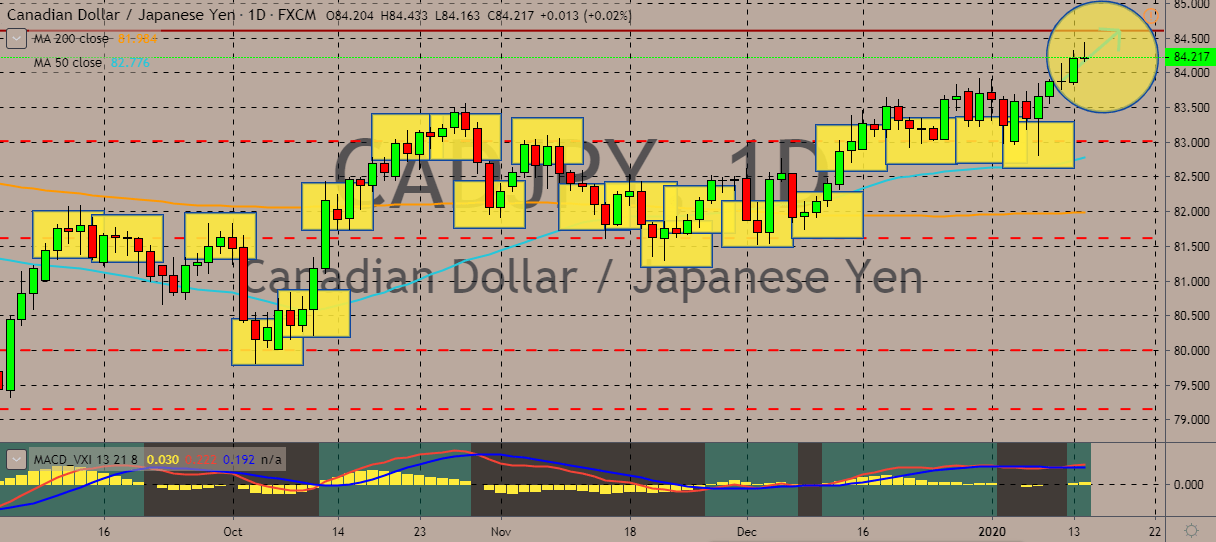
CADPJPY
Amid the positivity around business confidence, the Canadian dollar also gains against the Japanese yen, reaching record highs with the uptrend apparently not yet losing steam. At the same time, the Japanese yen, which is considered a safe-haven asset in times of economic turmoil and uncertainty, is weakening as trade and war tensions between the US, China, and Iran eased. Still, the CAD’s upside remains limited as investors still await the signing of a preliminary trade deal between the US and China this week. The optimism surrounding the trade deal has boosted many financial markets and assets, including the Canadian dollar. Canada has a current account deficit and is a major commodities exporter, meaning its economy could benefit from a better outlook for the global flow of capital or trade. With the confidence in business and optimism in trade, the central bank may decide to leave key interest rates unchanged despite sluggish domestic growth.


COMMENTS