

Here are the latest market charts and analysis for today. Check them out and know what’s happening in the market today.
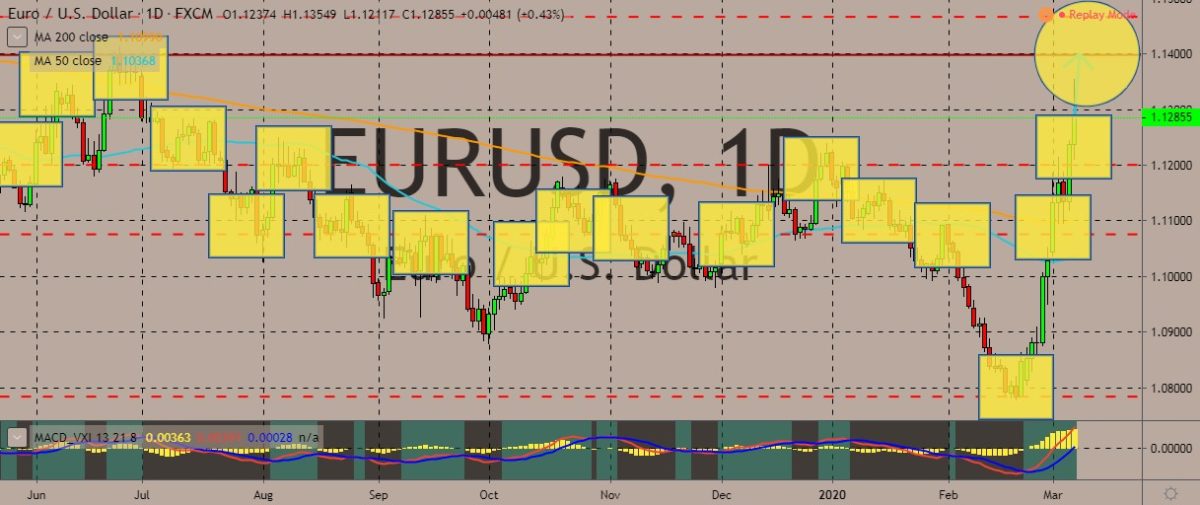
EURUSD
After breaking above the 50-day and 200-day moving averages, the pair has continued to go up the daily charts. The sentiment is still largely bearish for the pair, and the steep gains in recent sessions could be short-lived if a catalyst revives the dollar’s strength against the common currency. While the dollar is broadly lower across the board, business confidence in the eurozone apparently weakened. The March investor sentiment index declined to -17.1 from 5.2 in February, failing to meet consensus expectations for a reading of 11.1. This reading also markets the worst reading since April 2013. The expectations index also slid to -20.0 to 6.5 in February, marking its biggest month-on-month fall on record. According to experts, the data suggested investors were getting ready for a “long period of economic weakness.” Economists blame the coronavirus outbreak and the risk aversion coming from it for the global economy’s tendency to plunge into recession.
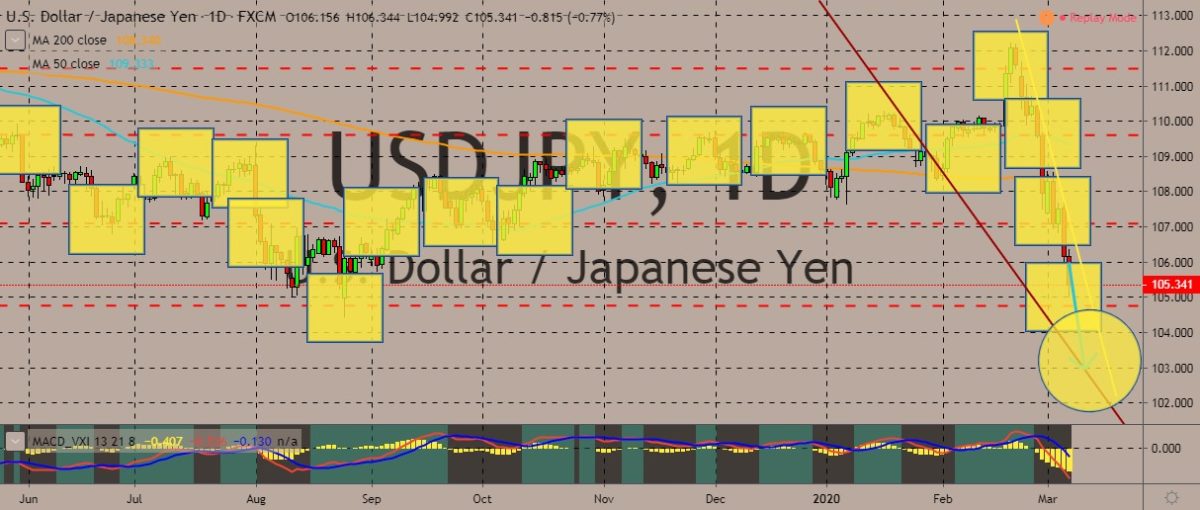
USDJPY
The US dollar is performing no better against the Japanese yen, too. On the daily chart, the pattern is incredibly obvious: the dollar is in freefall against the yen. Trajectory also remained downward, and losses became steeper as the price broke below the two moving averages, a move considered to be largely bearish for any pair. Across the whole forex market, currencies around the world beat the dollar to a pulp, with the Japanese yen being the best performer. At the same time, dollar investors felt the sharp pang of worries after US Treasury yields curved to record lows. The benchmark 10-year yield losing 40 basis points, while the entire yield curve slipped below 1% for the first time ever. The yen was near its biggest three-day gain since the 2008 financial crisis. For the last 12 days, the Asian currency has been up around 9%. Other currencies are also moving because of disruption around the markets, particularly the oil markets.
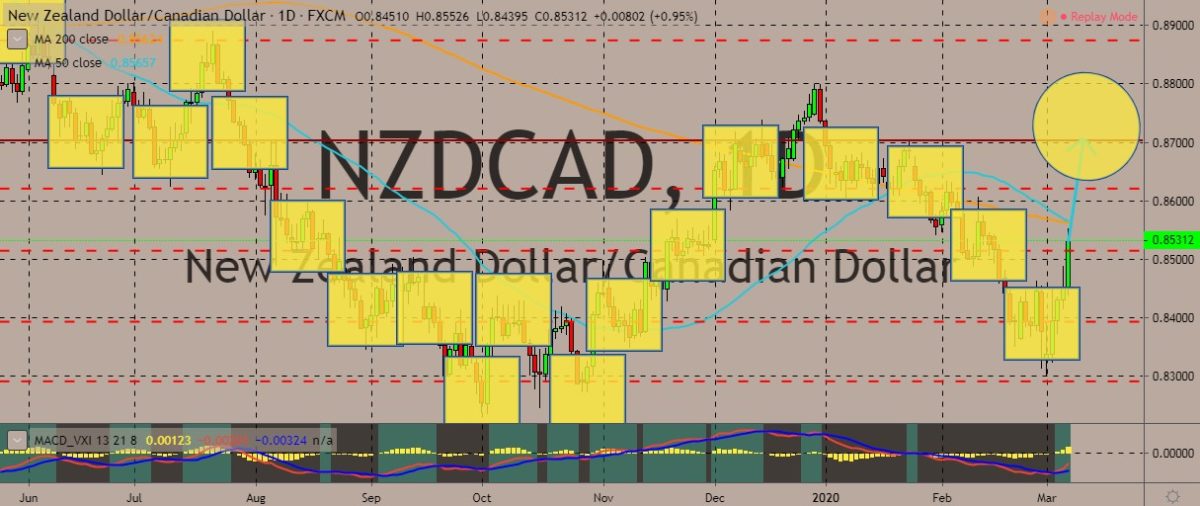
NZDCAD
The pair is creeping near the two moving averages, and if it could break above these levels, prices could be up for a steep gain, although the positioning of the 50-day moving average looks as if it’s ready to break below its 200-day counterpart, which means bearishness for the New Zealand dollar and bullishness of the Canadian dollar. However, with what’s happening in the oil markets, the Canadian dollar isn’t likely to strengthen against the NZD anytime soon. The CAD is a commodity-linked currency, as oil is one of Canada’s major exports. It is also still suffering from the shock of last week’s Bank of Canada rate cut of 50 basis points. The cut came as oil prices plummeted almost 10% after some of the worst declines since the global financial crisis of 2008. Meanwhile, the coronavirus is seen to pummel the loonie even further as the Italian quarantine in Europe threatens to dampen Italian, eurozone, and global growth outlooks.
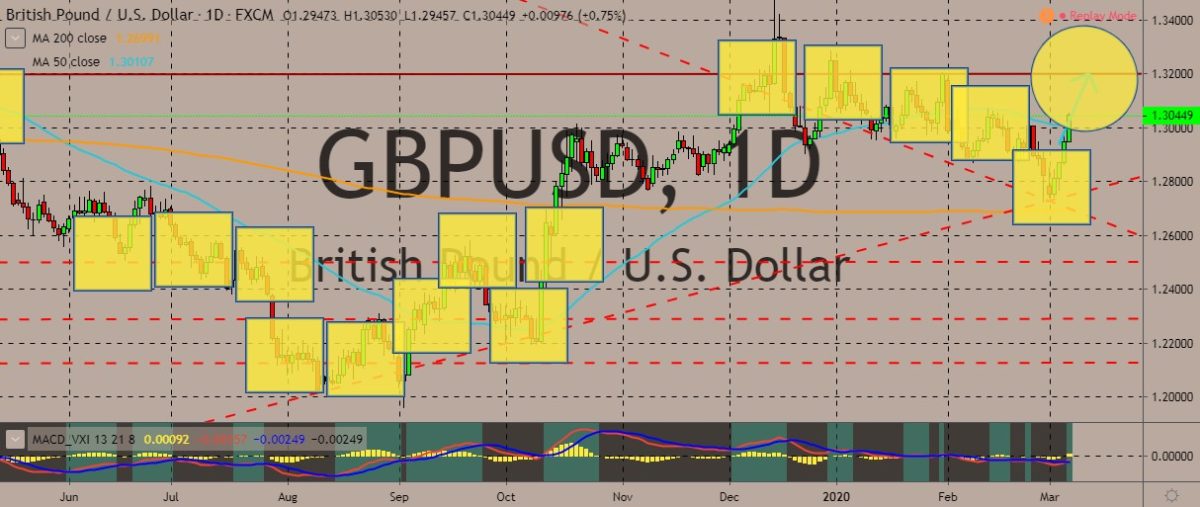
GBPUSD
The British pound also gained ground against the US dollar, trading higher than the 50-day moving average and reaffirming the bullish sentiment surrounding the currency pair. With the British pound’s strength and the US dollar’s broader weakness, the pair is expected to continue exploring the upper regions of the daily chart. But even though the dollar is the marked casualty of today’s downturn, the British pound’s strength remains vulnerable to the global environment. The weekend saw continued confirmations the COVID-19 is spreading outside of China. Authorities are also continuing to adopt some measures aimed at preventing the disease’s more rapid spread. As mentioned, Italy is quarantining the whole population of Lombardy, and the move could have massive impacts on the Italian economy, which could affect the whole eurozone, and therefore the whole global economic outlook.


COMMENTS