

Here are the latest market charts and analysis for today. Check them out and know what’s happening in the market today.
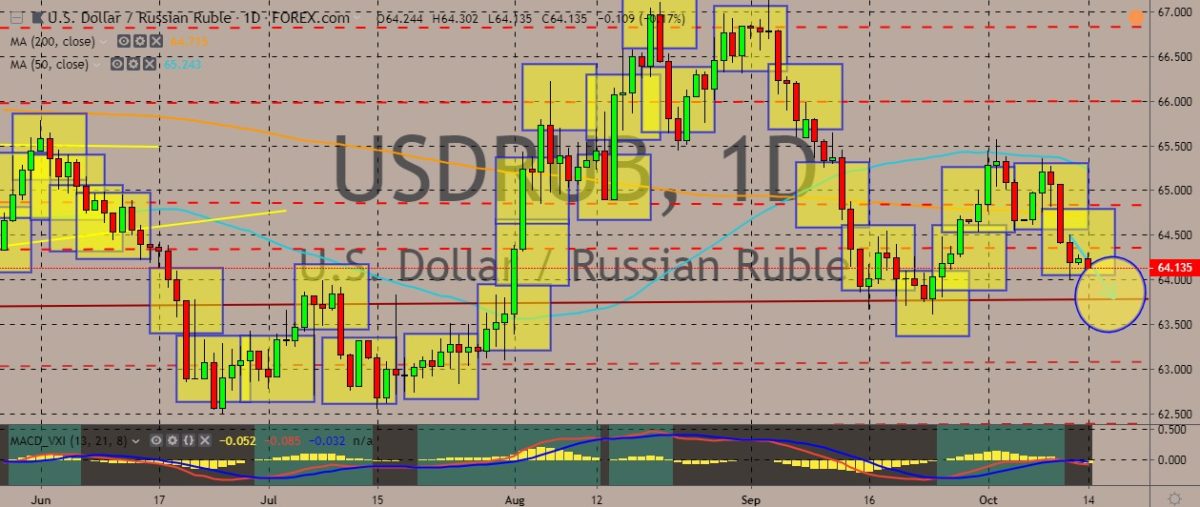
USDRUB
The pair is trading on a descending wedge, with prices going lower in the previous week as they go lower than the 50- and 200-day moving averages. In terms of fundamentals, Russian President Vladimir Putin said that Moscow is not blaming US President Donald Trump for failing to improve the relations of the two countries. Trump has previously pledged to improve the ties of Washington and Moscow during his election campaign. Putin commented that “internal political agenda” prevented the US President to make a drastic improvement of bilateral relations. He added that Russia would work with any US administration to the extend that the US wants. During the same interview, Putin said that Moscow can offer to ease the tensions in the Gulf following a string of attacks in the region. In an interview with Arab broadcasters, Putin said that Russia had good ties with Gulf Arab states and Iran.
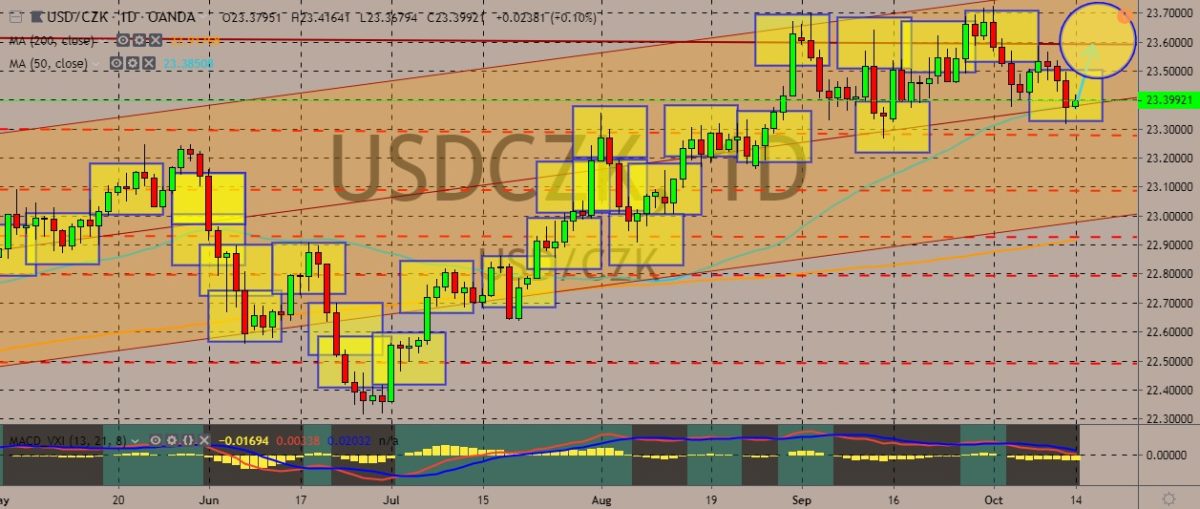
USDCZK
The pair failed to break above the upper band of the upward trading channel, although the overall trajectory of the price is an uptrend. The price is also trading above the 50-day and 200-day moving averages, indicating sustained bullishness for the pair at least in the short-term. The US dollar gained some strength over the weekend as the US and China announced some progress towards s trade deal. US President Donald Trump said that the two countries had sealed a “Phase 1” trade deal. However, to the markets, such a trade deal may simply be an interim truce. Over in the Czech Republic, data showed consumer prices saw their biggest month-on-month drop in September 2019 since September 2006. On a month-on-month basis, it fell 0.6% compared with that of August. On a year-on-year basis, consumer prices growth slowed to 2.7% in September. The decline on the monthly comparison was mainly because of price drop in recreation and culture.
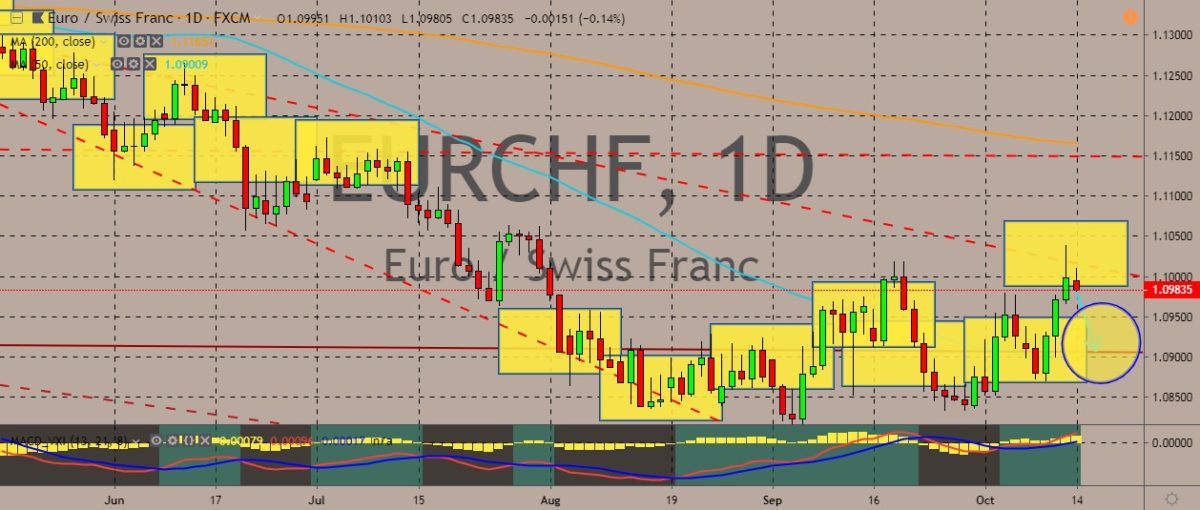
EURCHF
The pair is trading in the red in the current session after climbing up in the previous three sessions. This movement can mark the start of an uptrend after the pair traded sideways, which ended the downtrend it was pursuing below the 50- and 200-day moving averages. Over in the eurozone, conflict is flaring up as the bank becomes further divided over the European Central Bank’s decision last month to further loosen its monetary policy. Last September 12, the ECB’s governing council decided to send its base interest rate further into the negative. Over in Switzerland, the country’s central bank is working with its stock exchange to consider the potential usage of digital currencies in trading. The SIX Group said that it was working with the Swiss National Bank on a proof of concept for the project. A framework like that could include connecting the Swiss mechanism for clearing payments with SIX’s proposed digital exchange.
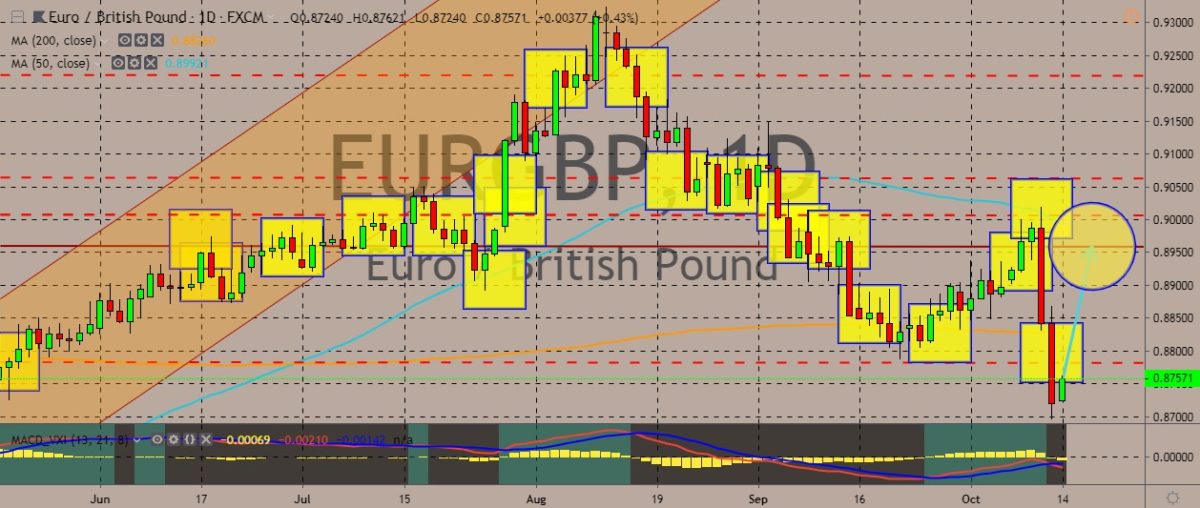
EURGBP
The pair plummeted in recent sessions and reached multi-month lows, breaking below 200-day moving average, indicating sustained bearishness for the euro against the pound. At the current session, it’s trying to pare its losses, but it would have to break above a solid resistance line first before reaching the 200-day moving average area again. As the eurozone scrambles to agree on the bond-buying program from the ECB, the UK is struggling with coming up with a deal that would satisfy both the EU and the UK side. Reports said that a “big gap” still bogs down the discussion, even though the UK has already made concessions to its plans for the Northern Ireland border after Brexit. According to EU chief negotiator Michel Barnier said that the UK plans on the tracking of goods were unacceptable. The EU and UK negotiating groups are expected to meet again in Brussels later in the day.


COMMENTS