

Here are the latest market charts and analysis for today. Check them out and know what’s happening in the market today.
EURGBP
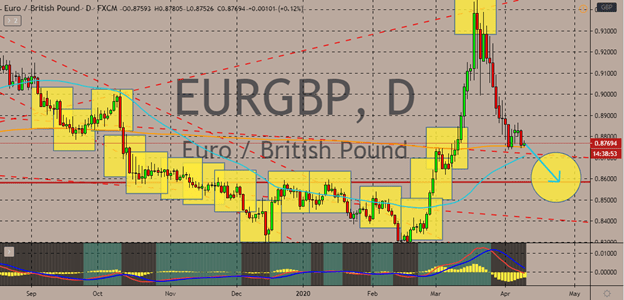
The EURGBP pair has collapsed as the euro becomes more vulnerable. This follows a rally from the latter half of February to early March. It’s believed that the turmoil among members of the European Union has caused the single currency to fall in the forex market. Apparently, due to the sheer damage brought by the pandemic, members of the block have not come into an agreement about possible unified measures for the bloc.
Bears feel a slight sigh of relief as they counter the previous strong rally. Due to the aforementioned rally, the 50-day moving average has climbed rapidly towards the 200-day moving average. However, due to the determination of bears to bring the pair down, the 50-day moving average has advanced slower. Meanwhile, the British pound is receiving support from the positive news that the UK Prime Minister Boris Johnson. Reportedly, he is responding well to the treatment given to him for the deadly coronavirus.
EURJPY
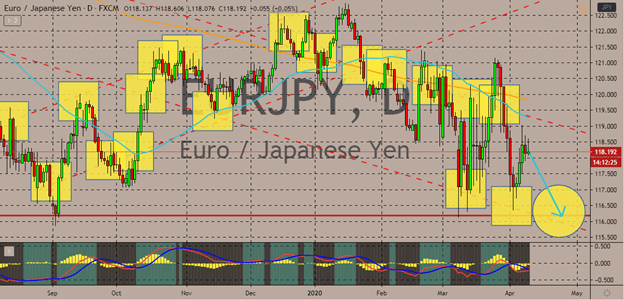
EURJPY bears and bulls have been on a constant tug of war. This is evident in the performance of the pair in the trading sessions. However, it’s now expected that the pair will be brought down once again to its support levels. Reportedly, the euro’s strength falters because of the hurdles faced by the eurozone. Members of the block have failed to agree on the reported €540 billion COVID-19 rescue plan. This is exposing clear division and opposition.
The pair remains bearish as the 50-day moving average moves notably lower than the 200-day moving average. However, investors doubt whether the pair could break past its resistance thanks to the heightening concern for the Japanese economy. Investors’ fears redoubled after Goldman Sachs stated that the Japanese economy will plunge to a record contraction of about 25% due to the pandemic. The forecasts come following the declaration of the Japanese Prime Minister of a month-long state of emergency.
USDCAD
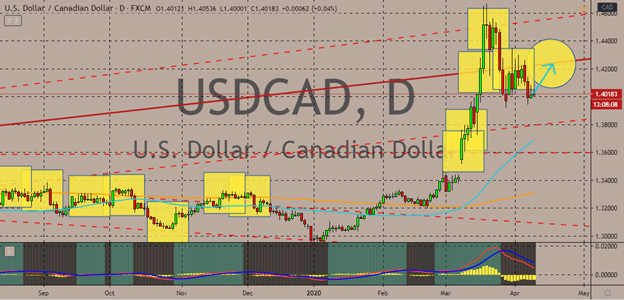
After the pair surged to its four-year highs last month, bearish traders have pulled the pair back lower thanks to the hopes for oil prices. However, investors believe that the pair will once again reach its resistance level as projections show that oil prices will crash once again, unfortunately, even below the $20 mark. See, the United States reported another build up in its crude oil inventory report.
As of writing, the Canadian dollar has steadied as investors wait for further guidance from the employment change report. Later today, Statistics Canada should release the monthly employment change results for March. It is unfortunately expected to plunge from 30.3K to -350.0K. Meanwhile, as for the greenback, bullish investors are waiting for positive results from the weekly initial jobless claims. It’s expected that the figures will recover from 6,648K to 5,250K this week thanks to the unprecedented efforts of the US authorities.
NZDUSD
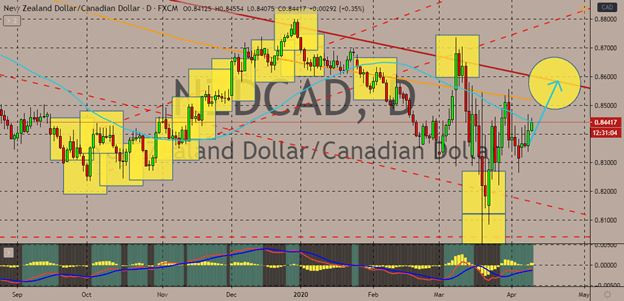
The odds are looking good for bullish investors of the NZDSCAD pair. Looking at it, the falling crude prices and the overall rebound of the kiwi has placed the bears on the defensive once again. However, it appears that the pair is still on bearish track considering that the 50-day moving average has even slipped lower against the 200-day moving average.
Although the New Zealand dollar has rebounded along with the equity markets as investors focus on the slowing number of new cases in the country. It seems that New Zealand still has control over the virus. The number of new cases has continuously fallen and so far, only one death has been recorded in the country. Meanwhile, the Canadian dollar is in trouble because of the dire predictions for the commodity market following the buildup reported from the United States again. It’s believed that crude prices would eventually collapse to levels below 20 dollars.


COMMENTS