

Here are the latest market charts and analysis for today. Check them out and know what’s happening in the market today.
EURUSD
The EURUSD pair has dropped on Monday. This follows the silent weekend from the market as the demand for safe-haven currencies grew. However, we now see bullish investors recovering some of their losses this Tuesday. They are taking advantage of the high volatility of the greenback on the upcoming earnings season. Even so, the pair is widely expected to turn bearish in its short-term run as the pandemic shines the spotlight to the greenback.
Looking at the chart below, the pair is still in bearish conditions. We see that the 5-day moving average has stayed significantly lower than the 200-day moving average. The reason for the weakness of the US dollar today is the cautious pace of investors ahead of a rough earnings season which is said to be the most important in the record. Despite that, projections show the euro will also underperform in the market. Furthermore, the little change from the recent sessions is a result of the holiday in the region.
USDJPY
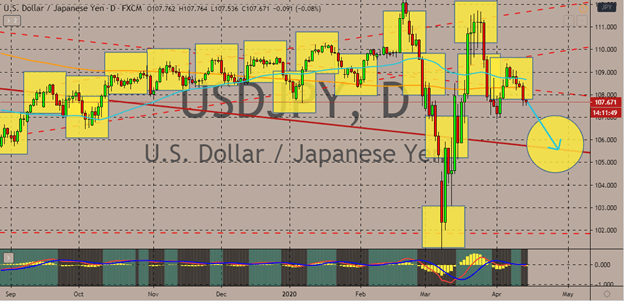
In the matchup between two safe-haven assets, the US dollar and the Japanese yen, the Japanese yen is seen prevailing in the recent sessions. The pair is bound to drop to its support levels in the upcoming sessions amidst the rough earnings session in the US. Bullish investors have recently stepped back to rethink the dollar’s long-term positions ahead of the monumental corporate earnings days. It’s believed that the USDJPY pair will fall to its resistance by the latter half of the month. Technically, the pair is still trading on a slightly bullish tone as the 200-day moving average remains marginally below the 50-day moving average.
The greenback received a slew of punches from the US economy last Friday. This follows the negative results from its March core CPI and CPI reports. The US Bureau of Labor Statistics reported that the March monthly core consumer price index dropped from 0.2% to -0.1%, unfortunately, worse than the projected 0.1%.
NZDCAD
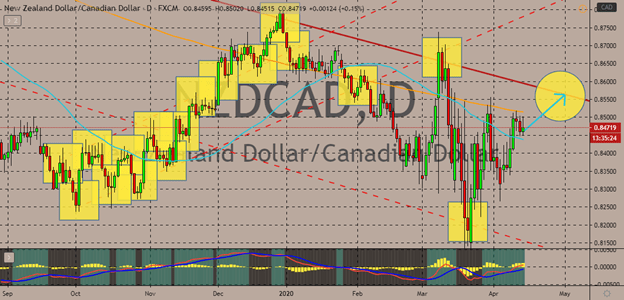
The recovery of oil prices in the recent sessions has slowed down bullish investors of the NZDCAD pair. However, that isn’t expected to last long as the New Zealand dollar receives support from positive news about the country. Considering that the 50-day MA is still trading below the 200-day MA, the pair is still widely bearish. However, bulls are looking to turn things around in the coming sessions.
The kiwi’s new-found strength comes from the news that domestic COVID-19 infections in New Zealand have declined. Aside from that, other fundamentals supporting NZDCAD bulls are the stronger-than-expected trade data from China and the recent statement of New Zealand’s Finance Minister about support efforts to help local businesses. As for the Canadian dollar, its strength comes from the rebound of the commodity market. Oil prices have started to gradually recover since the OPEC+ announced that it will be reducing supply cuts.
GBPUSD
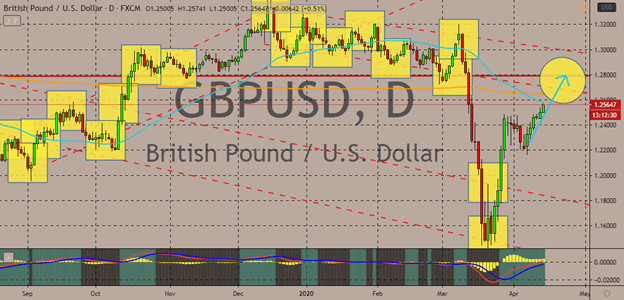
Bulls hold on to their momentum and are working hard to gradually force the pair higher to its resistance level. Investors of the US dollar have been holding back. They are waiting for further guidance from the US corporate earnings season, which should start this week. Investors believe this earnings season will be the most important earnings season since the Great Depression because of the sheer impact of the virus on corporate America. Bullish traders are looking to buoy the 50-day moving average back above the 200-day moving average.
Meanwhile, the pound sterling has defied the odds as it advances despite the alarming comment of the UK’s Chancellor. Rishi Sunak, the British Chancellor, recently warned that the UK’s gross domestic product could, sadly, dive from 25% to 30% in the second quarter of the year. The number of infections in Britain has now climbed near the 89,000 mark and its death to has breached the 11,000 mark.


COMMENTS