

Here are the latest market charts and analysis for today. Check them out and know what’s happening in the market today.
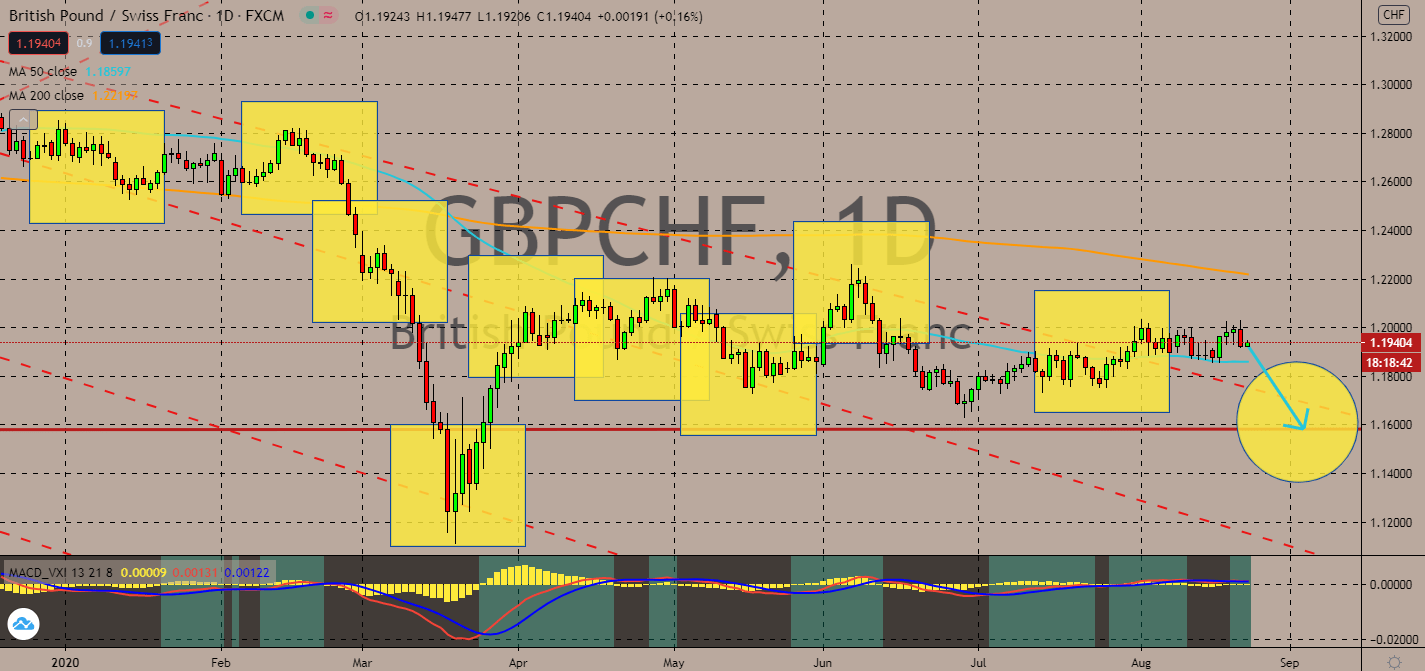
GBPCHF
Switzerland launched another quarantine lockdown for several Swiss cities last week, which undoubtedly prompts a disadvantage for its economy in the long run. However, a more pressing matter is bound to take over the exchange rate – the UK is experiencing a mass unemployment surge as ricochet of the economic effects of the coronavirus outbreak in the country. This is after the City saw a 220,000 decline in employment in the previous quarter in comparison to the previous one. For July, the number of employees on payrolls also fell by 730,000 when compared to May. As the 50-day moving average glides below the 200-day moving average, the now-recovering UK’s sterling pound is now projected to fall against the Swiss franc near-term with the looming possibility that it could recover as soon as Switzerland feels the aftermath of its freshly implemented lockdowns from the recent infection surge in the country.
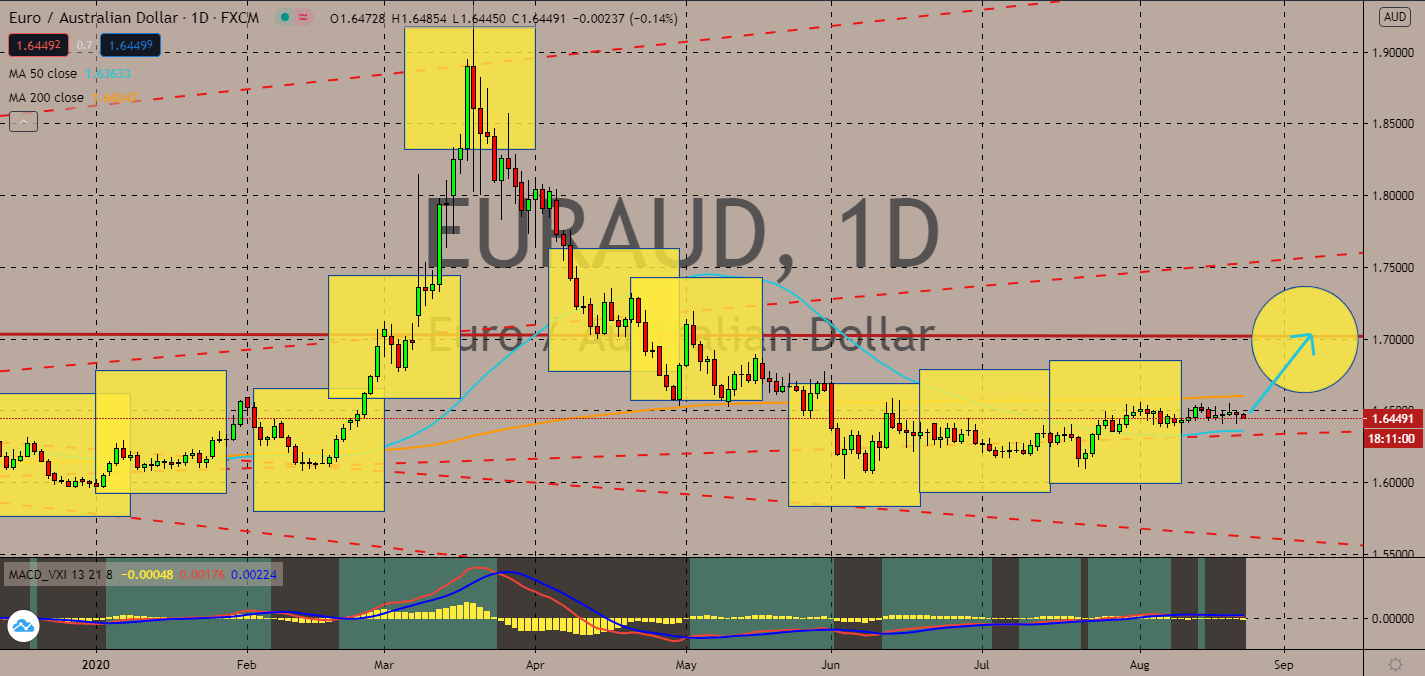
EURAUD
Although the pair’s 50-day moving average is still moving below the 200-day moving average, their corresponding economies are projected to lead the EURAUD back upwards into the bullish market. Economists believe that Australia’s biggest economic shock in history will push GDP to a cliff, even as its consumer spending is still holding up. Markets believe that once the JobKeeper stimulus package expires, the country will finally feel the brunt of its economic fall. Meanwhile, the euro economy is still in recovery despite a recent increase in coronavirus infections in the region. Data such as its purchasing managers indexes will help its currency boost against the Aussie dollar, although the exchange rate is treading through a stagnant market no thanks to hesitance led by the uncertainty revolving around the longer-term outlook for economies. Investors are now keeping a close eye on the eurozone’s services and purchasing markets.
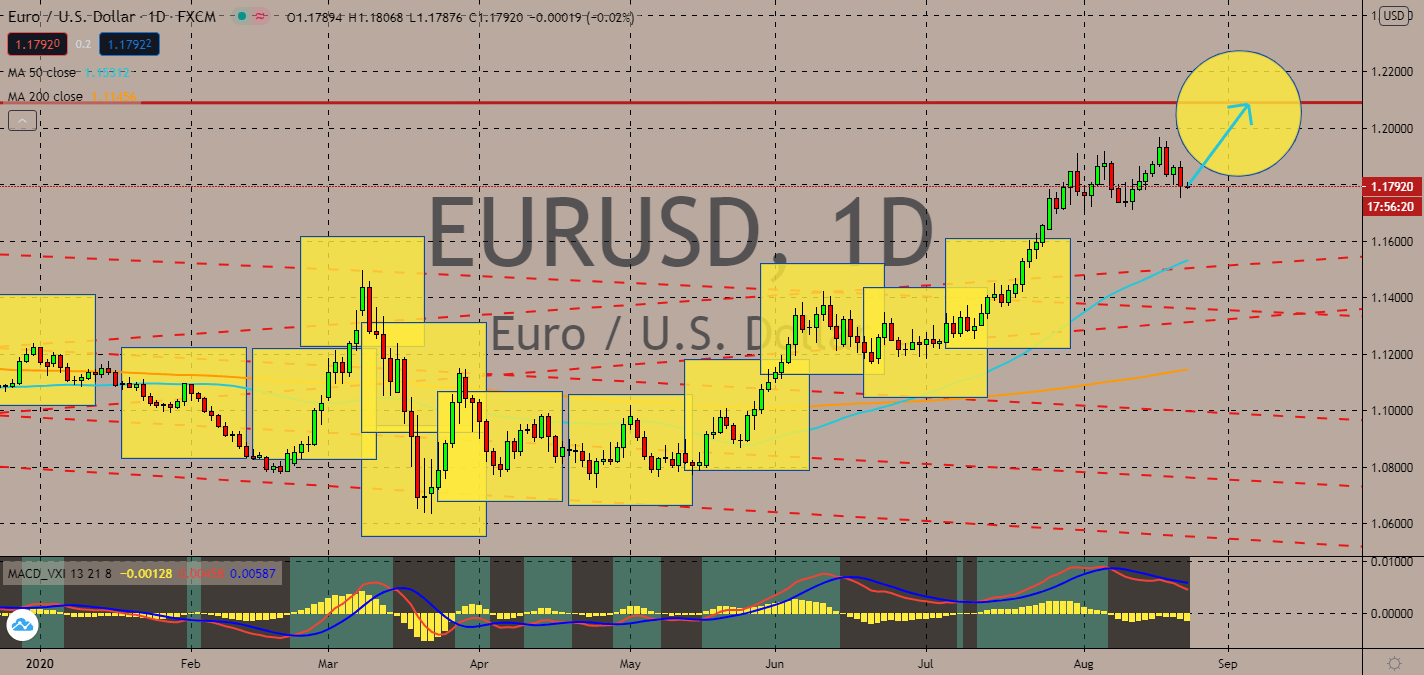
EURUSD
More and more economists believe that the eurozone’s economic recovery is losing steam after some of its participating countries were forced to implement new restrictions due to a resurgence in coronavirus infections. The sharp slowdown in its services sector undermined hopes for a V-shaped recovery in the bloc, but increasing demand and purchasing manager index figures are still expected to boost the euro currency near-term thanks to the fresh uncertainties pointed toward the US economy. In fact, new jobless claims in the US just reached the 1 million mark once again last week, showing that its economic recovery is still far slower than the market had expected prior – and they didn’t expect much. The pair’s 50-day moving average is still climbing far above its 200-day moving average, although the recent slowdown in the eurozone might hold the currency back from an unforeseen overbought zone in medium-term.
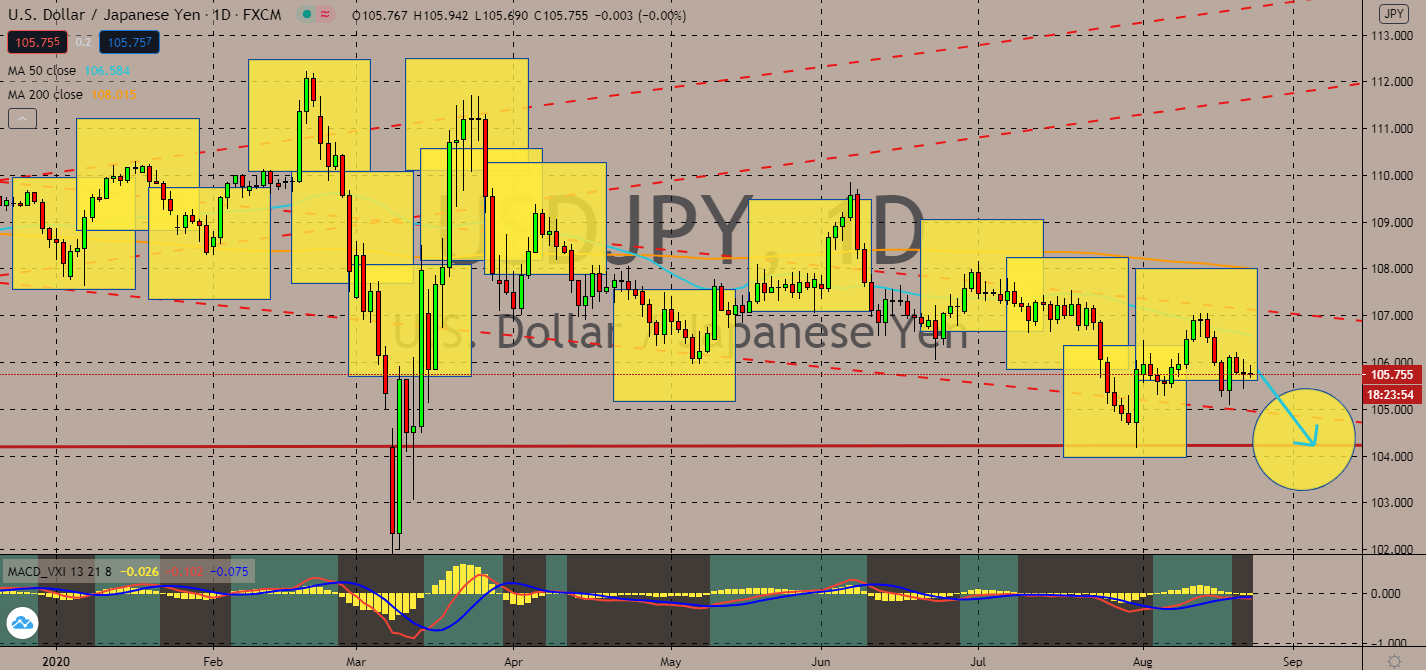
USDJPY
It looks like the market is still worried about the speed – rather, the lack thereof – of the US economy’s recovery. Although Japan announced a stagnant inflation rate, the USDJPY pair is still projected to fall into the bear market near-term as raising economic concerns shifts the gears of investors’ faith in the greenback. The number of workers filing for unemployment in the US jumped back to 1 million last week, but stock indices are still thriving, which shows that the stock market is gradually detaching from its economy, especially as more companies in the S&P 500 upgrade their earnings forecasts for 2020. Moreover, the forex pair’s 50-day moving average is still falling behind its 200-day moving average since it tripped down from the resistance levels seen in mid-July. Dollar weakness is projected to continue because of this, in addition to weak oil prices and the insistent rise in domestic coronavirus cases in the US.


COMMENTS