

Here are the latest market charts and analysis for today. Check them out and know what’s happening in the market today.
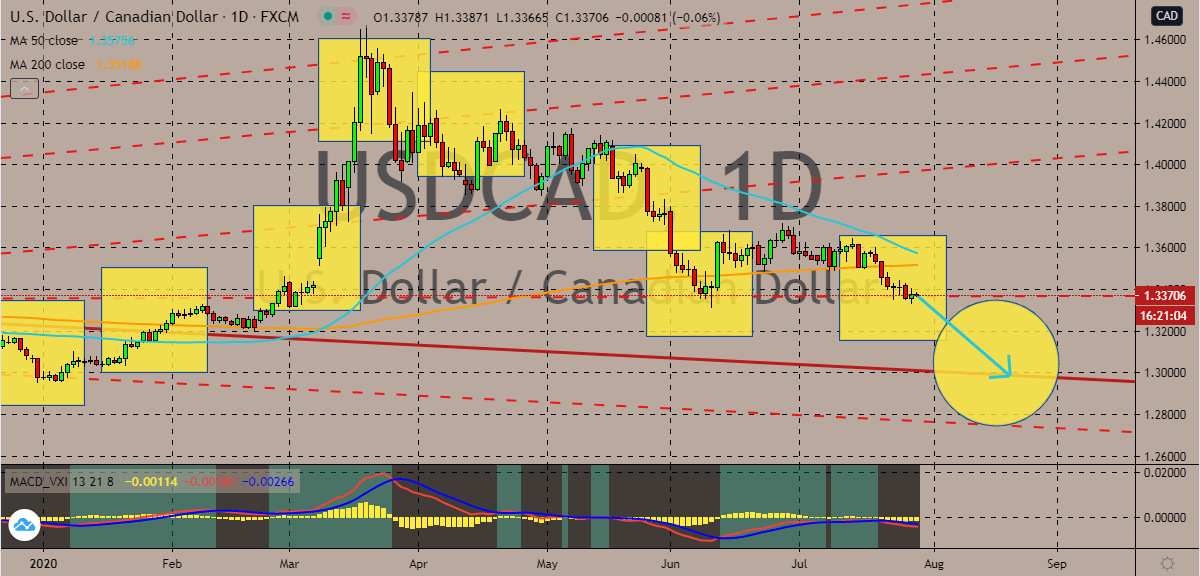
USDCAD
The US dollar to Canadian dollar exchange rate is currently facing a critical level, and as of writing, prices are seen trading neutrally as bulls try to defend themselves. Fortunately for bears, the pair is widely projected to go down towards its support level, hitting ranges last seen in early January 2020. The downside faced by the pair should ultimately force the 50-day moving average lower against the 200-day moving average, finally signaling a bearish market. The pair is pulled by the connection of the Canadian dollar to the commodity market. Oil has been steadily maintaining their ranges and the positive results from the American Petroleum Institute’s report are further helping crude traders’ cause. Another factor that’s driving the loonie is the fact that investors are now ditching the greenback for other safe-haven currencies or assets. The performance of the loonie is still closely linked to oil, and if oil slips, the loonie slows down.
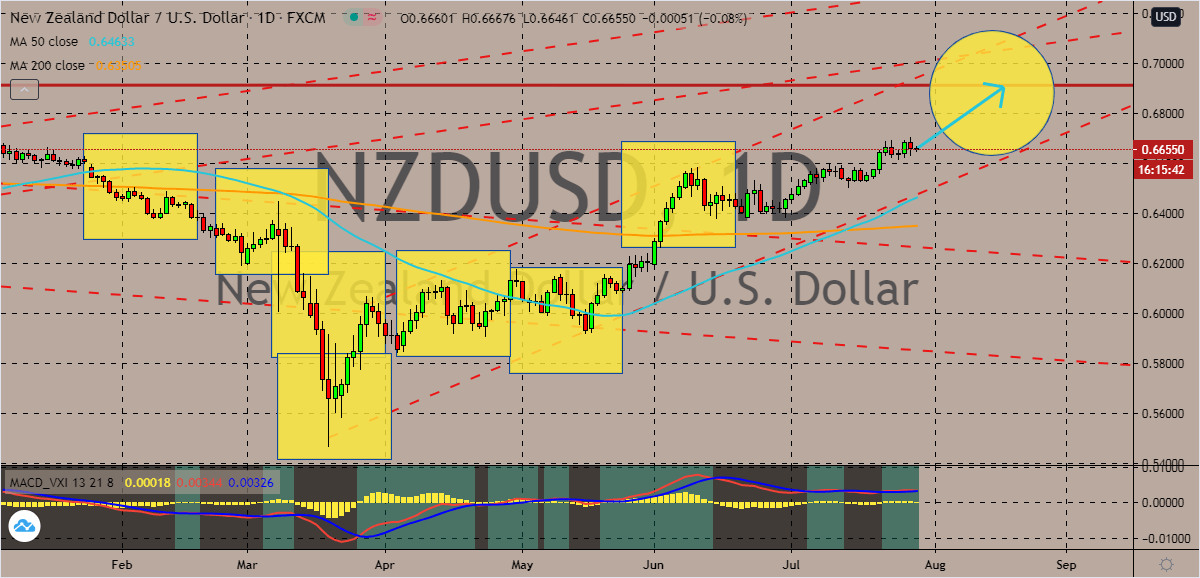
NZDUSD
The New Zealand dollar slightly slips against the US dollar this Wednesday as Australia, its biggest trading part, records a massive drop in its consumer price inflation. But despite today’s hurdle, the trading pair is projected to climb up towards its resistance as the US dollar is significantly weaker compared to other assets. Thanks to the successful handling of the New Zealand government on the coronavirus outbreak there, the kiwi has been undeniably strong in the market, taking down most major currencies like the greenback. The kiwi’s strength has allowed bearish investors to propel the 50-day moving average higher against the 200-day moving average. However, there are predictions that the kiwi’s rally would finally slow down. This is because of the bleak economic outlook of the global economy and its main trading partners, add to that is the brewing trade tensions between Washington and Beijing that could weigh on the global economy’s recovery.
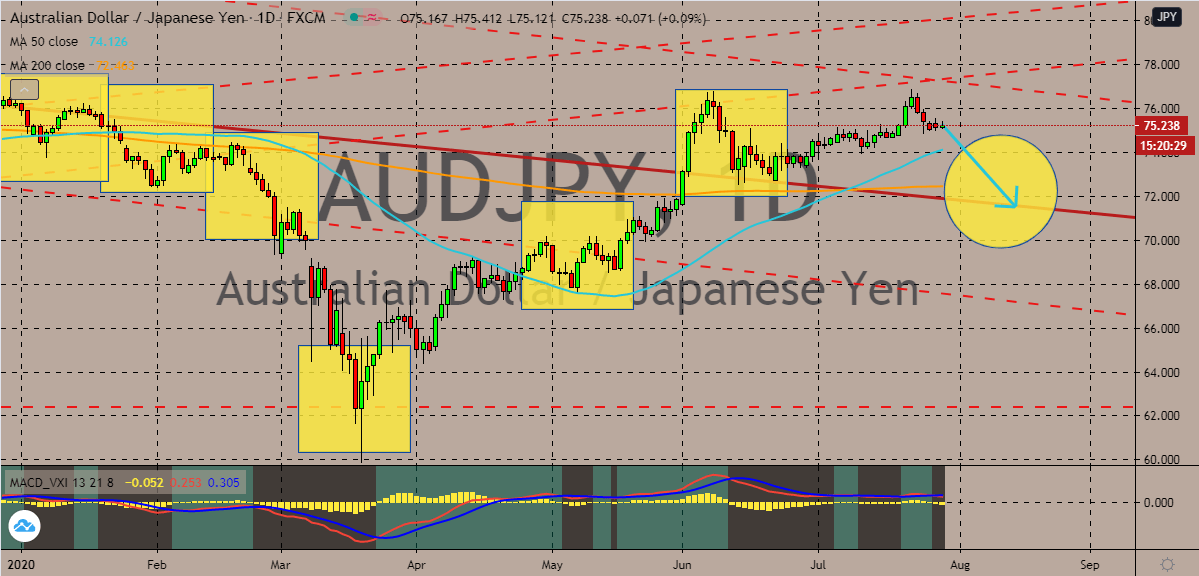
AUDJPY
The Australian dollar faces major roadblocks ahead and some believe that the Aussie to yen exchange rate lacks clear direction. However, based on the health of the Australian economy, the pair might see a downside in the coming sessions. In fact, as of writing, it’s seen that the Australian dollar is slowing down and is struggling to get back up on its feet against the Japanese yen. Prices could eventually gradually go down to its support level in the first half of August, bringing down the 50-day moving average closer to the 200-day moving average. Just yesterday, Australia reported that its quarterly consumer price index dropped from 0.3% to about -1.9%, slightly better than prior forecasts of -2.0%. But despite coming in better, it marks a grim time for the once-prominent Australian economy. This could greatly benefit the Japanese yen considering that most investors are staying away from the US dollar and are choosing other safe-haven assets.
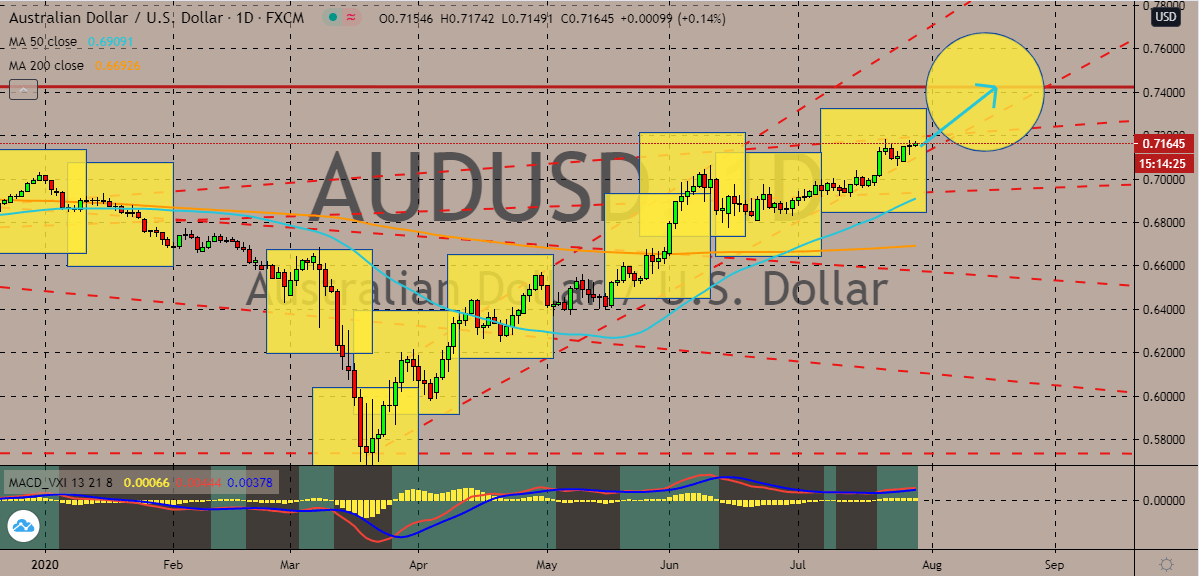
AUDUSD
The Australian dollar to US dollar exchange rate hit a crucial level this week, and the timing is great as Australia’s consumer price index was just released yesterday. Bulls struggled to break through this initial resistance, but it’s forecasted that the pair would continue to ascend to its higher resistance, reaching ranges last seen in November 2018. Bullish investors are looking to extend their lead and push the 50-day moving average much higher against the 200-day moving average. Moreover, it was just recently reported that Goldman Sachs, an American investment banking company, warned that the US dollar is facing risks such as the climbing debt level of the United States. Reports say that the country’s debt has gone beyond 80% of its gross domestic product. Other factors that are bombarding the greenback include the escalating political tension and risks in the United States, as well as the uncontrollable number of new coronavirus cases.


COMMENTS