

Here are the latest market charts and analysis for today. Check them out and know what’s happening in the market today.
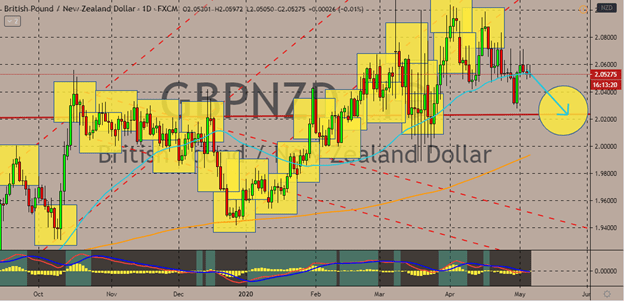
GBPNZD
The kiwi has forced its matchup against the pound sterling to steady thanks to the support from the positive results from New Zealand’s economy reported yesterday. Bearish investors are projected to force the pair lower in the coming sessions as they attempt to curve the 50-day moving average back down towards the 200-day moving average. Statistics New Zealand reported a surprise improvement in the country’s quarterly employment change data from the first quarter of the year. According to official figures, employment change rose from 0.0% to around 0.7%, unexpectedly better than the projected -0.3% prior. As for the British pound, investors are waiting for further guidance from the interest rate decision of the Bank of England due later this week. It’s widely expected that the BoE will leave its official rates unmoved at 0.10% this month. Aside from the interest rate decision, the bank will also release its inflation report.
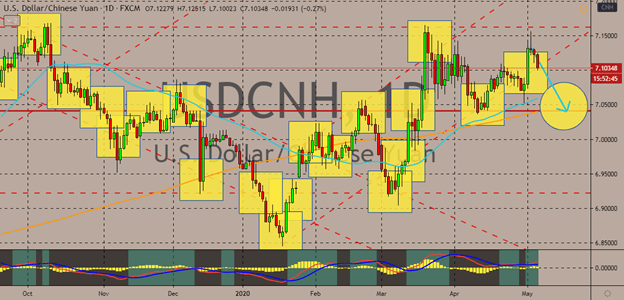
USDCNH
The recent tariff threats of the US President Donald Trump from earlier this week caused the US dollar to struggle against the Chinese yuan. Another round of sanctions against Beijing would definitely add further burden on the Chinese economy as it’s still recuperating from the lockdown’s paralyzing impact. But it would also boost the strength of the Chinese yuan in the short-term trading. This comes at a crucial time for bullish investors of the pair who have just managed to propel the 50-day moving average higher against the 200-day moving average. The United States President urged China yesterday to be transparent about the origins of the coronavirus outbreak that has caused havoc in the entire globe and has taken the lives of countless people this year. President Trump said that Washington will be releasing a detailed report about the origins of the virus soon but failed to give further details as to when.
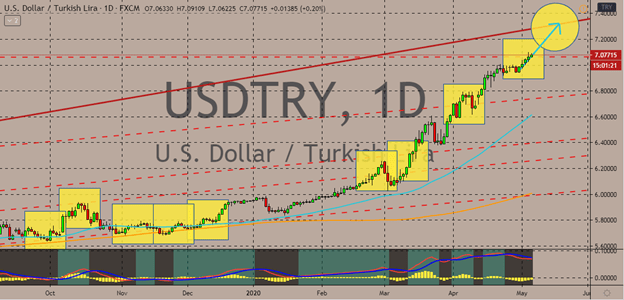
USDTRY
The US dollar to Turkish lira exchange rate is now trading at its highest level last seen in August 2018 during the Turkish financial crisis. And unfortunate for the Turkish lira, it’s still expected to depreciate even further against the greenback in the coming sessions. The pair is bound to reach its resistance level by the halfway point of the month, forcing the 50-day moving average significantly higher than the 200-day moving average. The economic hurdles faced by Turkey has brought the lira back on its knees against most currencies. Investors are weighing out the devastating economic fallout brought by the novel coronavirus pandemic. And despite the assurance from Ankara about reviving the harshly struck economy, it still paints concerns regarding the outlook of the economy and lira. Meanwhile, the Turkish treasury reportedly took advantage of the drop in yields and sold approximately $1.6 billion in debt just recently.
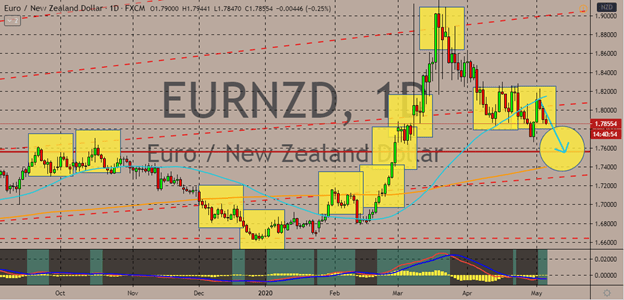
EURNZD
Optimism about the conditions of New Zealand’s economy has boosted the kiwi against the euro in recent sessions. The euro to New Zealand dollar trading pair is projected to crash to its resistance thanks to the better-than-expected results posted by the country’s economy that gave bearish investors a delightful surprise. The pair is expected to maintain its bearish descending direction in the coming sessions as investors target the support area. Moreover, further guidance is expected today from New Zealand’s economic activities. Scheduled reports such as the yearly labor cost index and inflation expectations are believed to support the rally of the New Zealand dollar in the trading sessions. Meanwhile, the broader weakness faced by the euro in the market has allowed kiwi to snatch greater gains against it. The single currency is facing troubles as the recent court verdict challenging Germany’s participation in the Eurozone’s stimulus programs.


COMMENTS