

Here are the latest market charts and analysis for today. Check them out and know what’s happening in the market today.
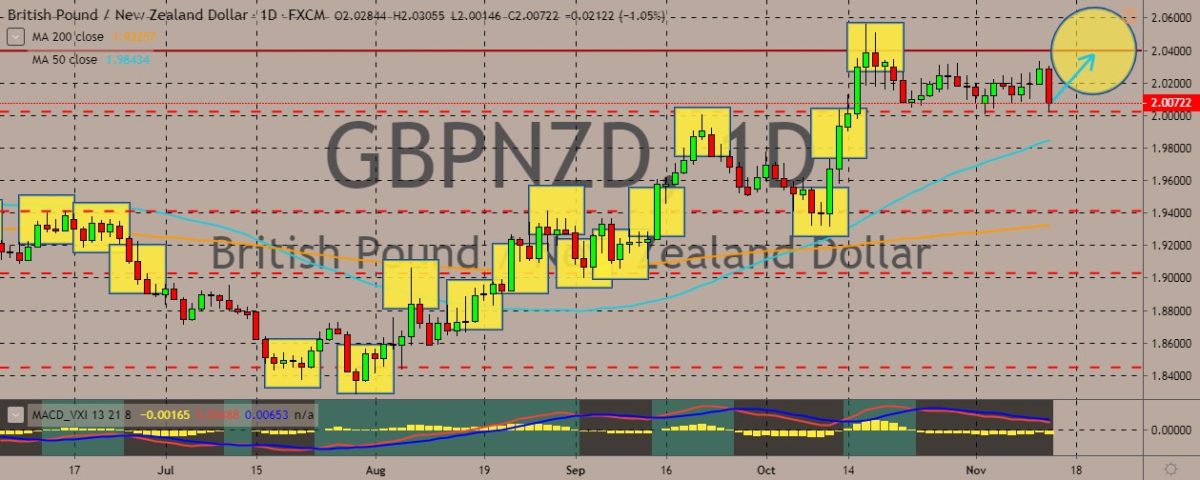
GBPNZD
The pair has been trading sideways for the past trading sessions, with the latest move in the red. The 50-day moving average appears ready to go up, indicating that traders are bullish on the pair and signaling a buy opportunity for them. Over in the UK, a survey showed that the probability of a no-deal Brexit declined as Prime Minister Boris Johnson appears ready to win the December general elections. Such a victory would let him secure the solid backing in parliament that he needs to get his new Withdrawal Agreement approved. Meanwhile, the Reserve Bank of New Zealand surprised the market after it decided to put its official cash rate (OCR) on hold. All major banks had expected a 25-basis-point cut. As a result of the central bank’s decision to hold rates, major banks are now scrambling to reassess their outlook for the year. Meanwhile, the RBNZ said that though inflation remained below target, economic development didn’t warrant any policy change.
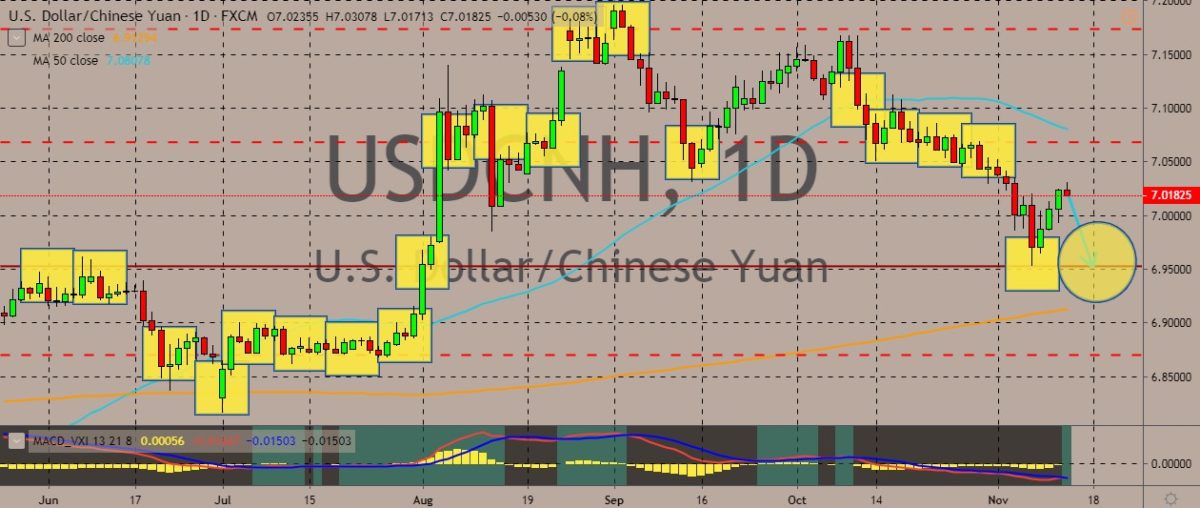
USDCNH
The pair has recovered from its slump last week. It’s headed to rise to monthly highs, but headwinds await as the 50-day moving average appears ready to get down. On the trade war front, US President Donald Trump threatened to escalate the US-China trade war saying that the US will increase tariffs on Chinese goods if the first step for a broader deal isn’t reached. “They’re going to be raised substantially,” Trump said. According to the POTUS, the Asian country is “dying” to hammer out a deal with the US and that he’d sign it only if it’s good for American companies and workers. Meanwhile, Trump also praised the overall gains that the US economy has recorded under his administration. He also lambasted the Federal Reserve for not cutting interest rates to below zero. He also took the opportunity to say that a Democratic victory in 2020 would not be good for the stock market’s gains.
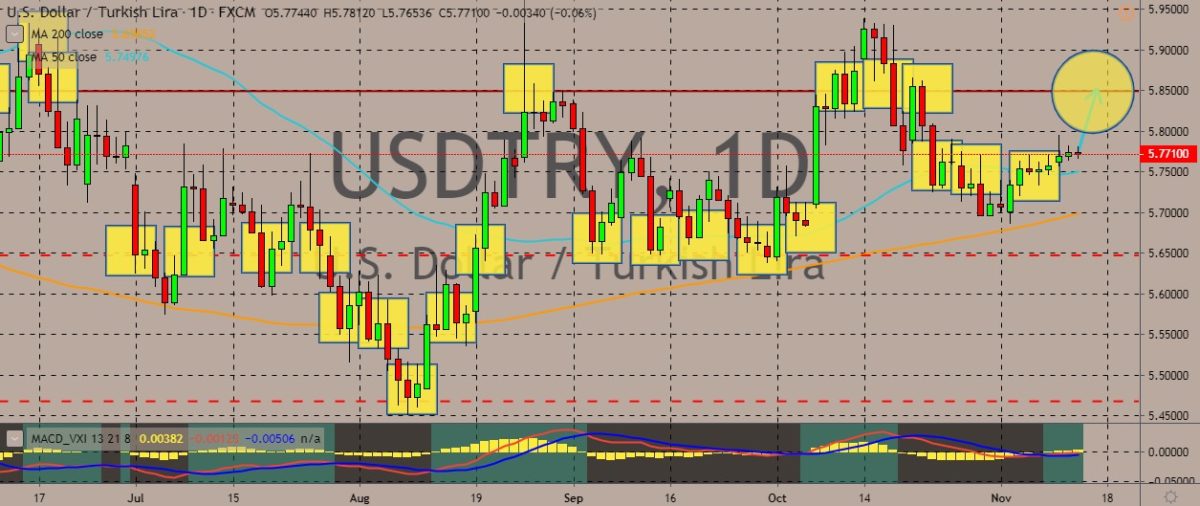
USDTRY
The pair recently rose above its 50-day moving average, indicating some pretty solid buy signal for traders. It recently traversed ranging territories. Turkish President Recep Tayyip Erdogan will meet US President Donald Trump at the White House amid the soaring tensions between the two NATO allies. The tensions are connected to the countries actions in Syria as well as Turkey’s purchase of Russian missile system. But the differences between the two countries go way beyond Syria and missile systems. Turkey is drilling for oil in contested waters off Cyprus. Washington has also issued criticisms over human rights abuses. Also, Turkey has helped Venezuela launder money and gold to circumvent US sanctions. Moreover, Turkey also has a pretty solid relationship with Iran, which is something that runs against US policy. Erdogan is also facing allegations of corruption within his inner circle.
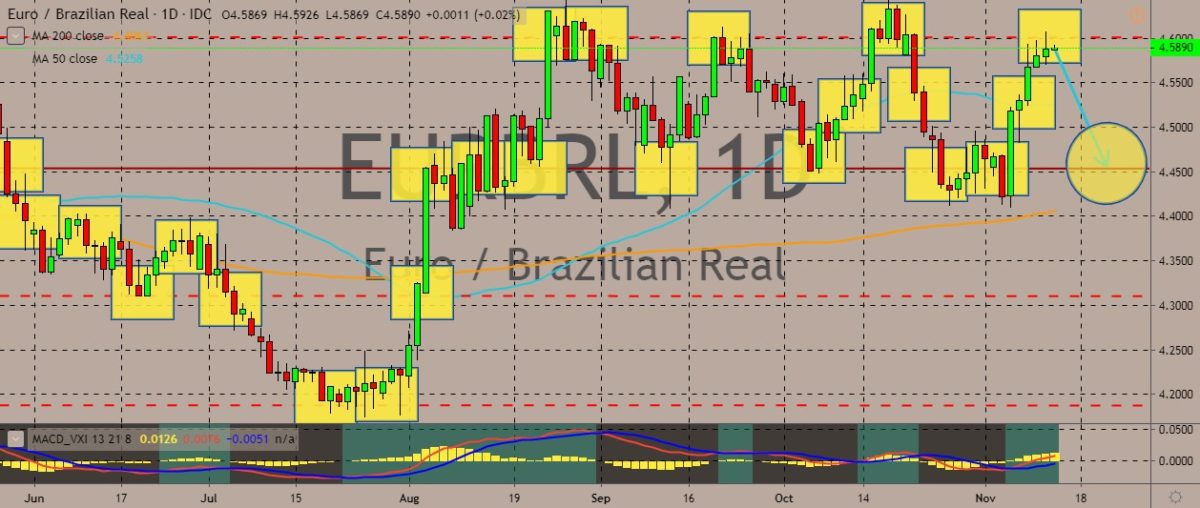
EURBRL
The pair is on its uptrend, trading in ranges since mid-August and reluctant to tread a clear trend. At present, the pair appears to have run the course of its latest uptrend. If the pattern is going to be followed, it is set for a downward move below the 50-day moving average which it recently broke. For economic and political news, Brazilian President Jair Bolsonaro’s bashing of China on the campaign trail last year made diplomats from both sides concerned that he might wreck the BRICS, one of the world’s biggest trade partnerships. However, this week, Chinese President Xi Jinping will visit this week for the BRICS summit, and the event looks set to repair the ties. The presidents of Brazil, Russia, India, China, and South Africa (BRICS)—the world’s top emerging economies are meeting in Brazil capital this week for what the market and world expect to be a low-key, technical meeting.
 ts
ts


COMMENTS