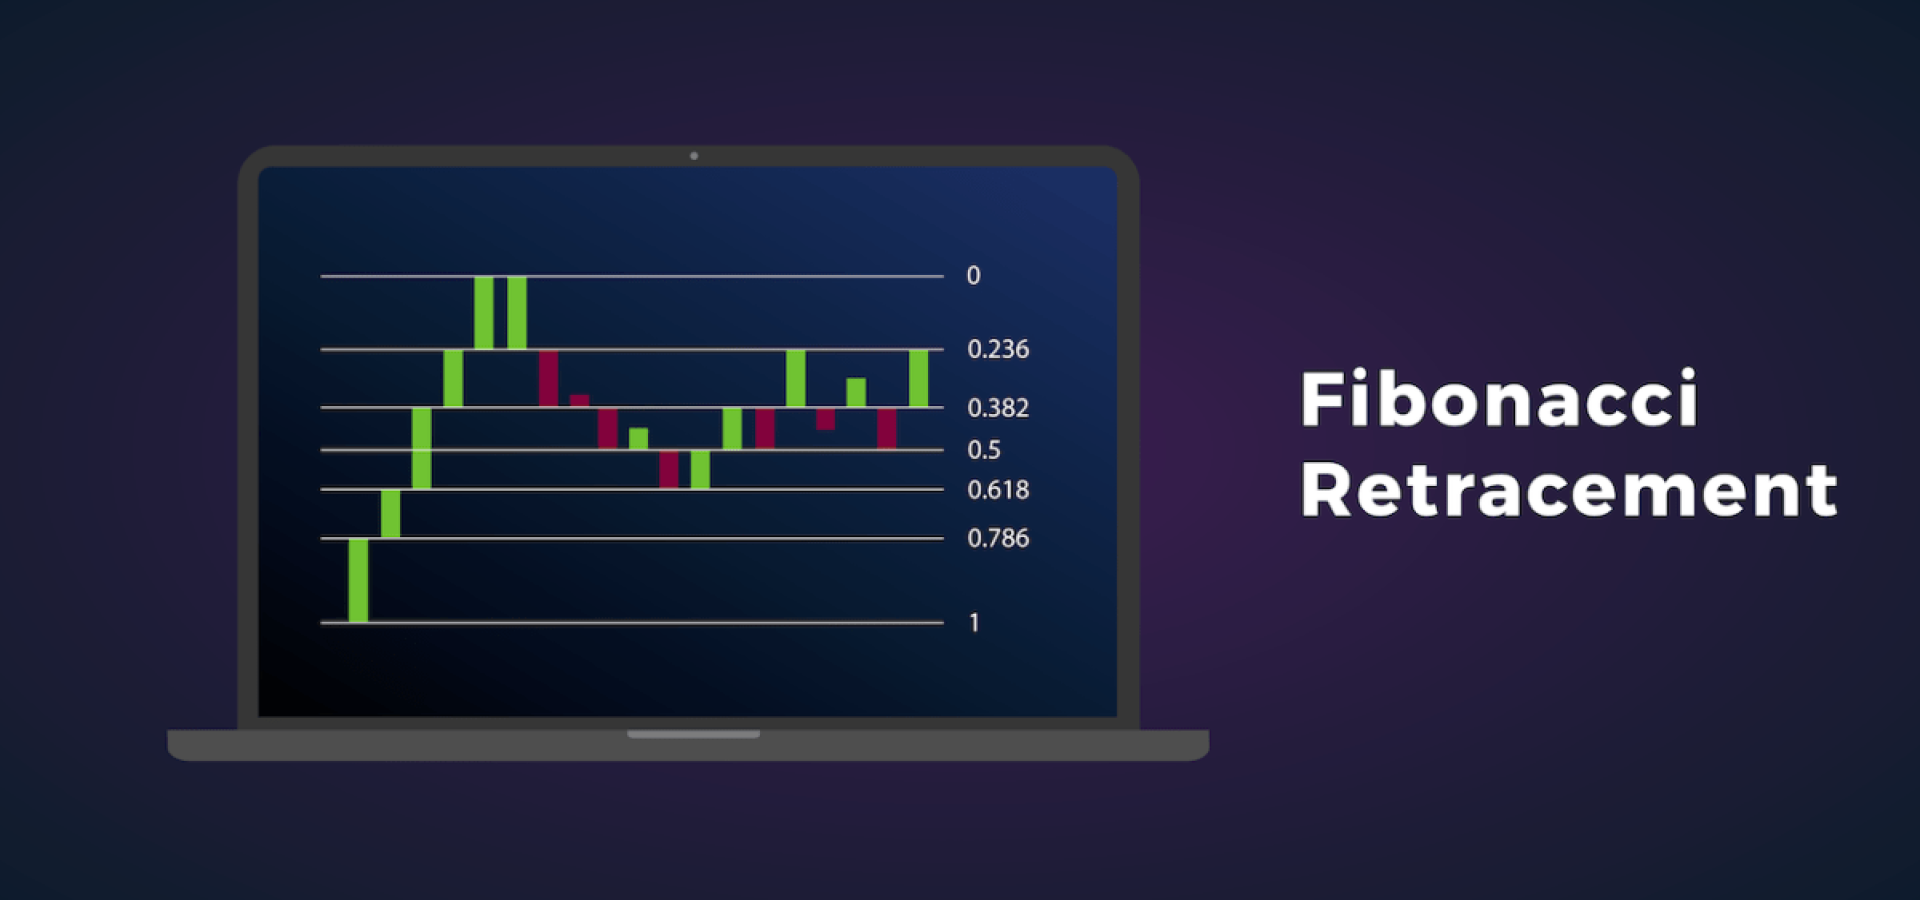
A Fibonacci retracement is a popular technical analysis method for the possible future price predictions in financial markets. If appropriately used, Fibonacci retracements and ratios can help traders determine upcoming support and resistance levels based on past price movements.
Leonardo Fibonacci was a mathematician born in 1170 AD. From his work, we got the Fibonacci sequence and the famous Fibonacci golden ratio. The Fibonacci sequence is basically a combination of numbers. Here, the next number is just the sum of the previous two numbers. So, for example, it will run 0, 1, 1, 2, 3, 5, 8, 13, 21, 34, 55, 89, 144, etc. The sequence continues indefinitely.
Fibonacci retracement is calculated based on the theoretical reproductive rate of two rabbits and the population growth when the subsequent generations continue to reproduce.
Let’s discuss what do the 12th-century mathematicians and today’s technical analysis have in common.
Fibonacci’s golden ratio
The focus is often the ratio between the numbers in the sequence. As we further down, any number in the series divided by the previous number will get 1.618. The name of this ratio is “Fibonacci Golden Ratio.”
For Fibonacci followers, many examples follow this ratio (or the inverse of the number, 0.618). It seems to play a massive role in the building blocks of everything around us.
Fibonacci for forex traders
How is this series of numbers and forex connected? It turned out that the Fibonacci Golden Ratio and the financial market have the same mathematical. When traders use the golden ratio in their technical analysis, the balance is usually converted into three percentages. These percentages are: 38.2% (traditionally rounded to 38%), 50%, and 61.8% (traditionally rounded to 62%). Traders can use more multiples when necessary, for example 23.6%, 161.8%, 423%, 684.4%, etc.
Forex traders use Fibonacci retracements to determine where to place orders to enter the market, take profit, and stop-loss orders. Traders often use Fibonacci levels in foreign exchange transactions to identify and weigh support and resistance levels.
After the price has risen or fallen sharply, new support and resistance levels are usually located at or near these trend lines.
Traders draw horizontal lines on the chart to draw the key Fibonacci retracement levels of 38.2%, 50%, and 61.8%. It helps them determine the area where the market may retrace before the overall trend forms.
When the market approaches or reaches major price support or resistance levels, Fibonacci levels become very handy and important.
The 50% level is not part of the Fibonacci sequence. However, analysts still include it due to the market’s extensive experience in trading that retraced about half of the primary trend before resuming and continuing its trend.
Traders use Fibonacci levels of foreign exchange strategies
Every trader’s strategy is different, so as an investor, you need to consider how each of the following strategies fits your overall market perspective. Not every trader uses the following options, and it does not matter if they do not serve your system. Techniques to use Fibonacci retracements include:
- You can buy near the 38.2% retracement level, and the stop-loss order is set at a level slightly lower than 50%.
- You can buy near the 50% level, and the stop-loss unit is below the 61.8% level.
- When entering a sell position near the top of the big move, you can use the Fibonacci retracement level as a profit closing target.
- If the market retracement approaches one of the Fibonacci levels and then resumes its previous movement, you can use the higher Fibonacci levels of 161.8% and 261.8%. With this, you can determine possible future support and maintain levels if the market exceeds The high/low of this level.
Bottom line
Almost all traders have their trading style or a set of strategies to maximize profit potential and control emotions. Fibonacci trading strategies use complex data. If traders stick to their plan, it might minimize the emotional interference.
Traders can use the discussed strategies for long-term and short-term trading, ranging from a few minutes to a few years. However, due to currency changes, most transactions might get executed within a relatively short time frame.


COMMENTS