
Traders regularly use foreign exchange indicators to increase their chances of profit in forex trading.
Together with other forms of data and analysis, indicators can influence trading decisions and be used as the basis for foreign exchange trading strategies.
With the ability to examine past market behavior and patterns, traders use the best foreign exchange indicators to help predict future market behavior and thereby expect which transactions may be profitable.
Before trading on the following market platform, foreign exchange traders will check various data to measure the performance of the market and possible future changes.
What are Forex indicators?
Forex indicators are a way to check market data. Indicators examine historical data of currency prices, trading volumes, and market performance and try to predict the future behavior of the market and possible repeating patterns.
Once traders have this information, they will make more informed trading decisions and obtain higher returns.
If you use indicators to help you make trading decisions on your following markets account, you need to use the best foreign exchange indicators. Knowing which indicators may be the most accurate with so many options for new traders may be challenging.
Therefore, today, we will introduce you to one of the most common, well-known, and most commonly used MACD trading indicators.
What is the MACD indicator and how can you use it?
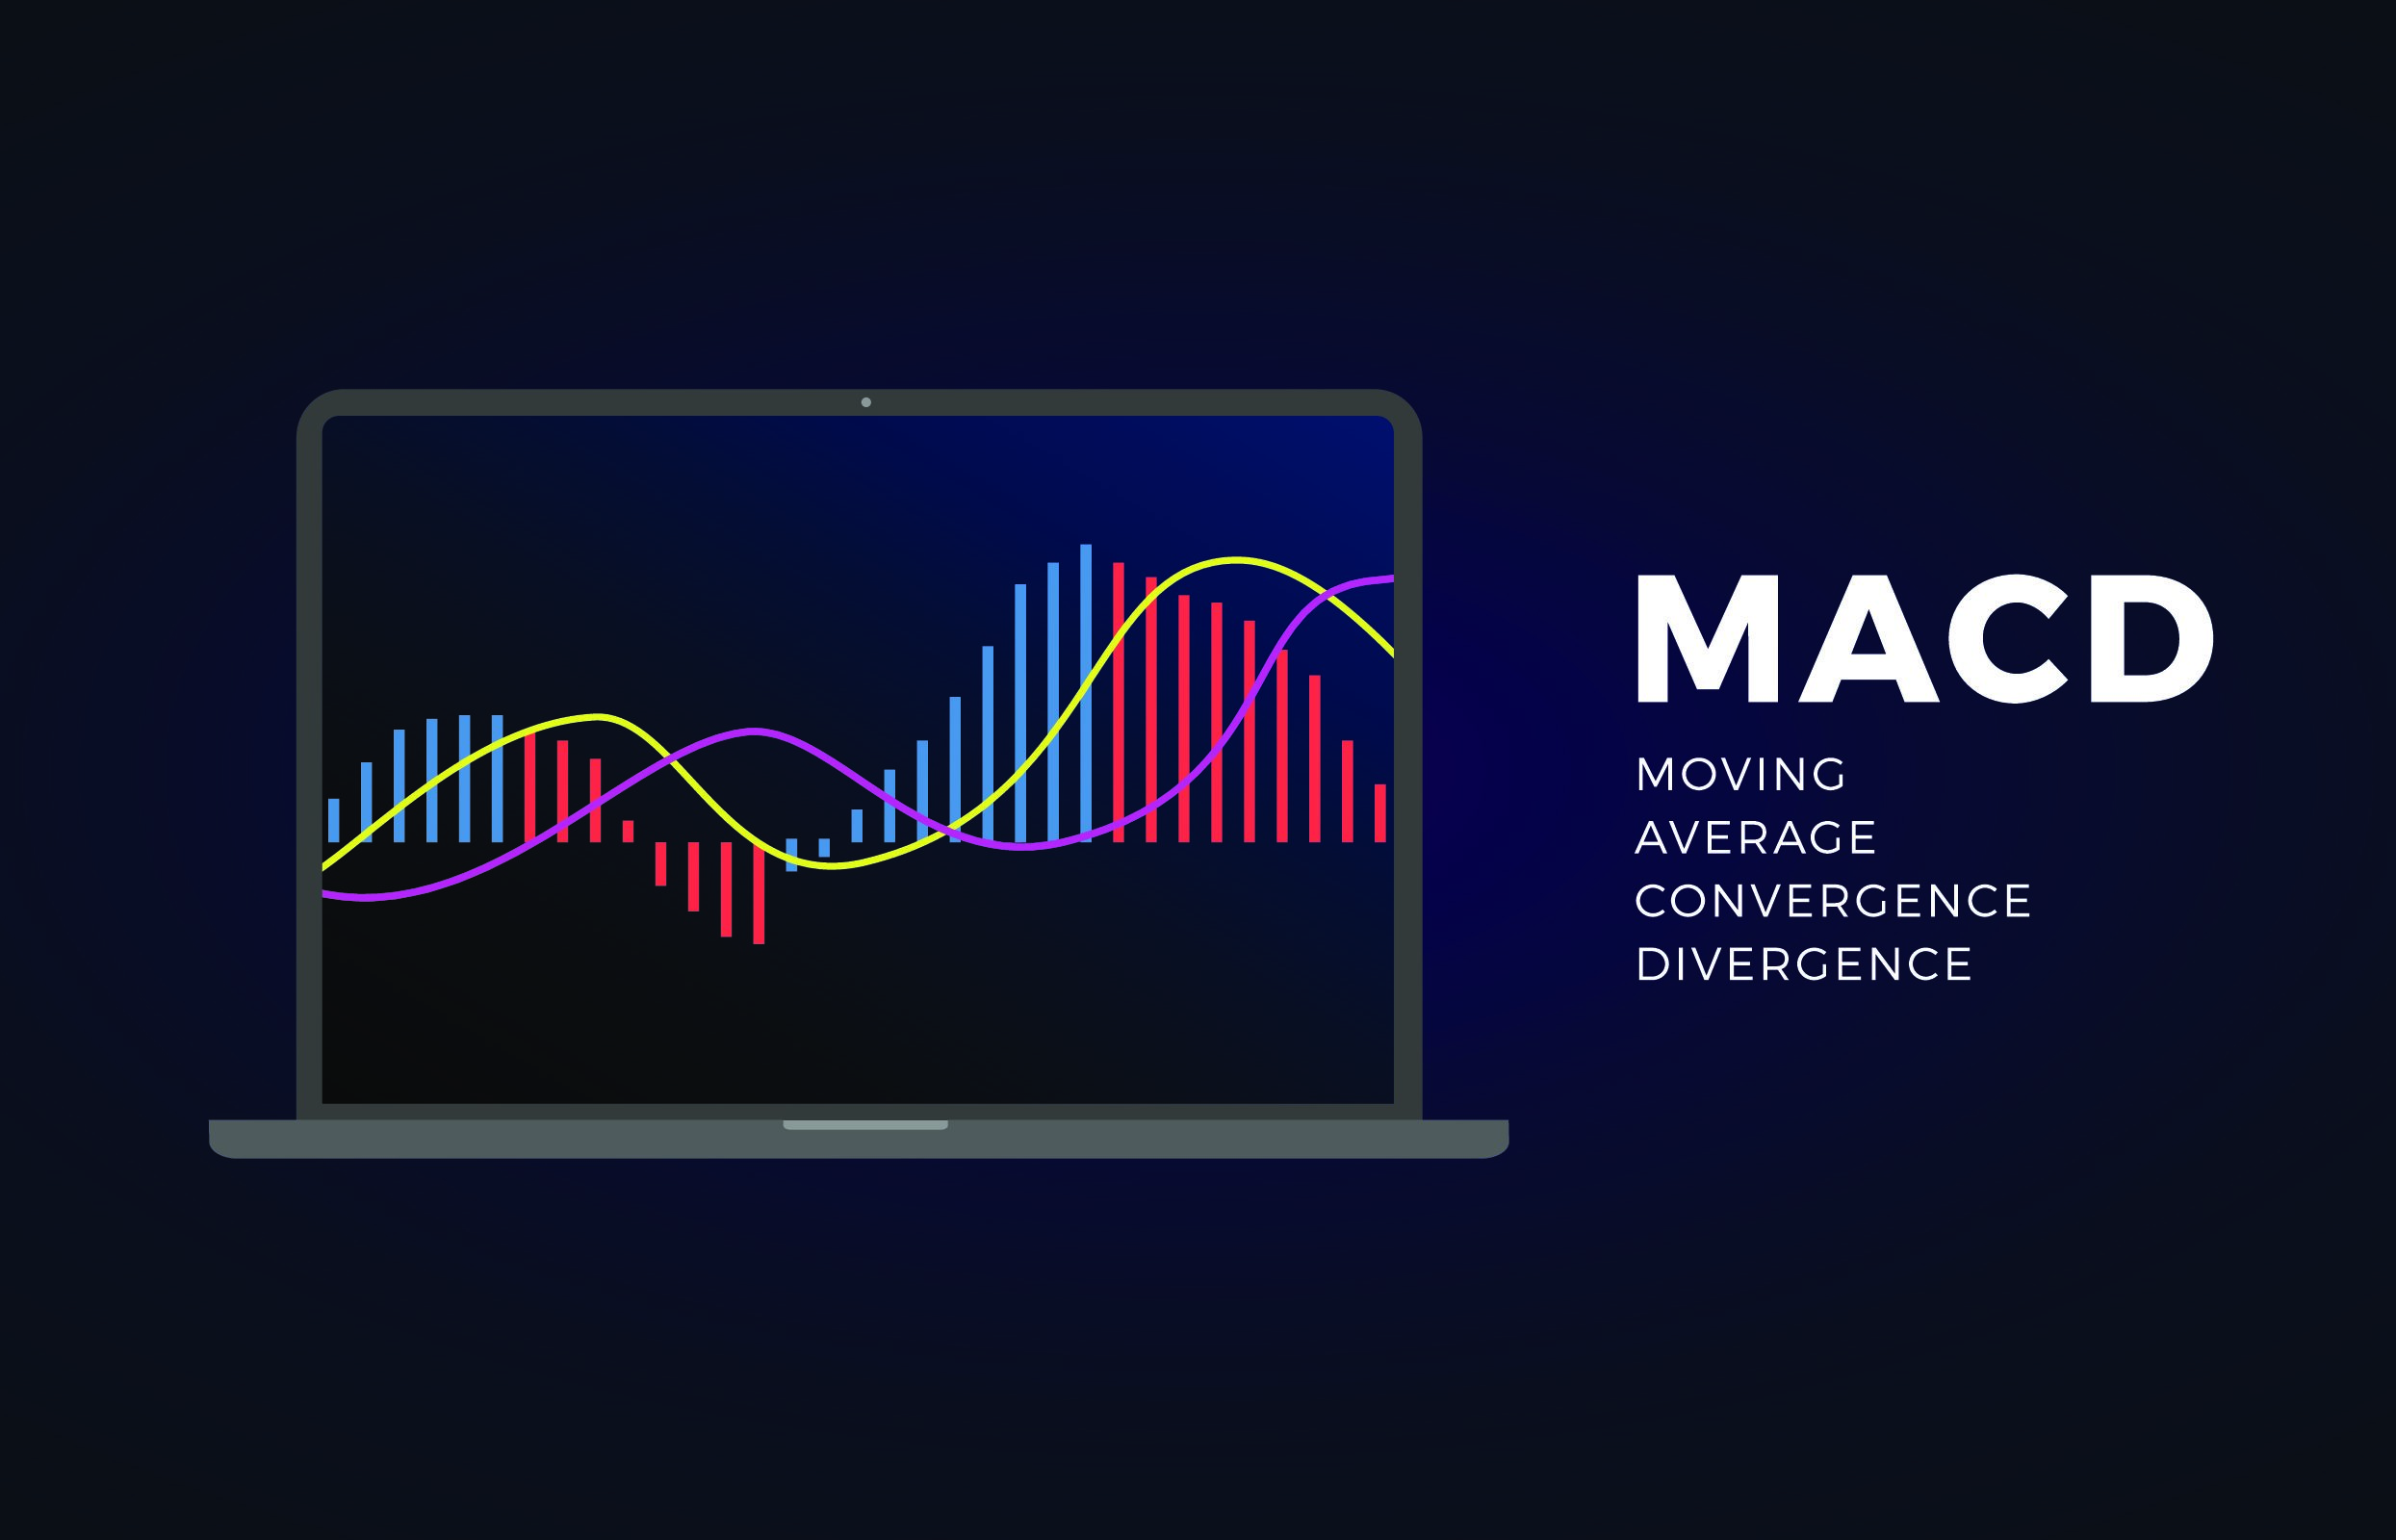
MACD stands for Moving Average Convergence Divergence. It is a technical indicator measured with the relationship the Exponential Moving Average (EMA). MACD shows MACD line (blue), the signal line (red), and histogram (green)-shows the difference between MACD line and the signal line.
The MACD line is the difference between two exponential horizontal moving averages—usually 12 and 26 periods, while the signal line is typically the 9-period exponentially smoothed average of the MACD line.
These MACD lines fluctuate in and around the zero lines. It gives MACD the oscillator’s characteristics, as it gives overbought and oversold signals above and below the zero line, respectively.
What exactly does MACD indicator measure?
MACD uses MACD line and zero lines as reference points to measures momentum or trend strength:
- When the MACD line crosses above the zero lines, it indicates an uptrend
- When the MACD line crosses below the zero lines, it marks a downtrend
In addition, when two MACD lines cross, MACD signals a buy or sell order, as described below:
- When the MACD line crosses above the signal line, traders use it as a buy instruction
- When the MACD line crosses below the signal line, traders use it as a sell instruction
How is MACD calculated?
Most charting platforms provide MACD indicators and use the default period mentioned above to achieve this calculation. The following formula breaks down the different components of MACD for the convenience of traders.
As mentioned earlier, the MACD histogram plots the difference between two moving averages. The histogram moves around the zero designation on the MACD indicator.
Histogram becomes positive when the MACD line is above the signal line. The situation is the opposite when the MACD line is below the signal, and the histogram will be drawn below zero as a negative value.
The zero value on the histogram indicates the crossover of two moving averages, thus marking a buy/sell signal.
Why should you choose MACD indicator?
According to lots of experienced traders and experts, MACD is the best trading indicator for trading in trending markets. This limits its use to traders according to their trading strategy. For example, when using MACD, the range and consolidation market usually gives defective signals.
Traders need to understand the MACD and when to use this indicator to achieve the best use. Novice traders may initially find this indicator challenging to use, which is why the basic moving average and EMA fundamentals will benefit traders who wish to use the MACD indicator.
The changes that the MACD indicator can achieve are almost limitless, which is very personal for traders. This subjective nature of MACD means that the results will vary from trader to trader, eliminating any consistency. When using the MACD indicator, traders need to follow this basic outline:
- Choose EMA parameters
- Use an appropriate time frame, as MACD may play different roles in different time frames.
Wrapping up
To conclude, the MACD trading indicator is a bit complicated to explain but highly beneficial and valuable. It gives you accurate market predictions that help you make the right decisions.
However, don’t forget that forex trading comes with its risks. No prediction can 100% guarantee your trade’s success. Thus, think twice before you join the industry. Trading indicators will help you minimize your risks.


COMMENTS