

Here are the most recent market charts and analysis today. Check them out below and discover new insights.

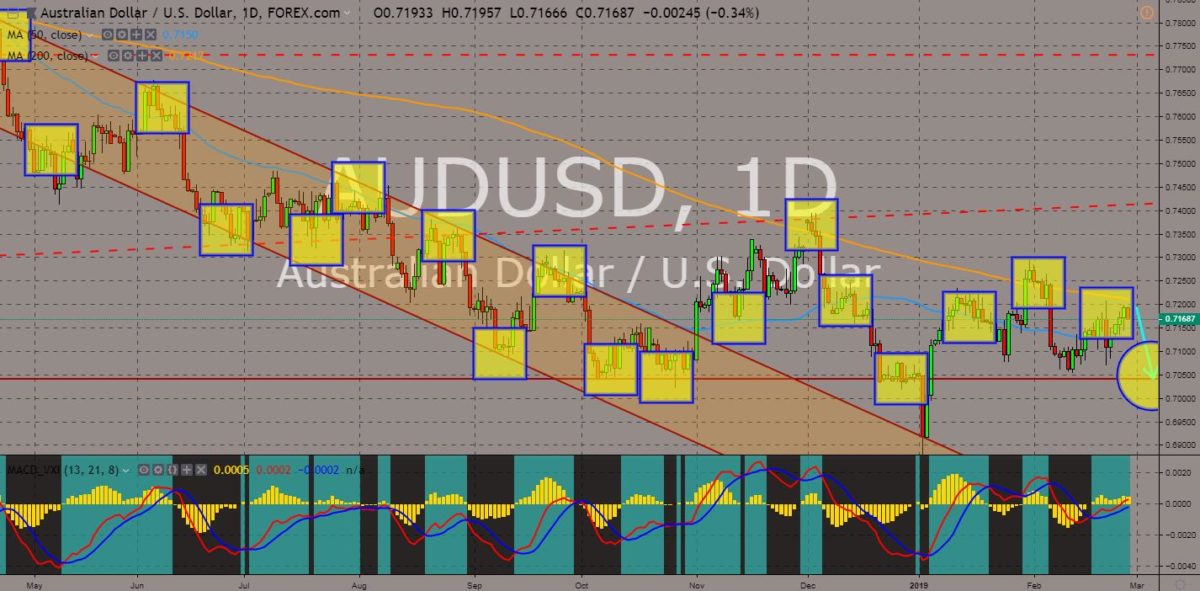
AUDUSD
The pair failed to break out from 200 MA for the third time this February, sending it lower to its support line. Australia will face a looming Federal Election on May. Generally, a country is vulnerable during times of election as major policies are put on hold and the country’s future are dim as Australia was set to elect a new prime minister. The incumbent Prime Minister Scott Morrison was widely expected to lose during the election and naming a new Prime Minister will be its sixth in just a decade. The recent decision by the United Nations to hand over Chagos Islands to Mauritius puts the US defense system at risk. The United States is currently leasing the biggest island in the archipelago from the United Kingdom, which is set to expire on 2030. This will push the US to make military alliance with Australia as it patrols the second and third passage way that gates the East and the West. Histogram and EMAs 13 and 21 will fall.
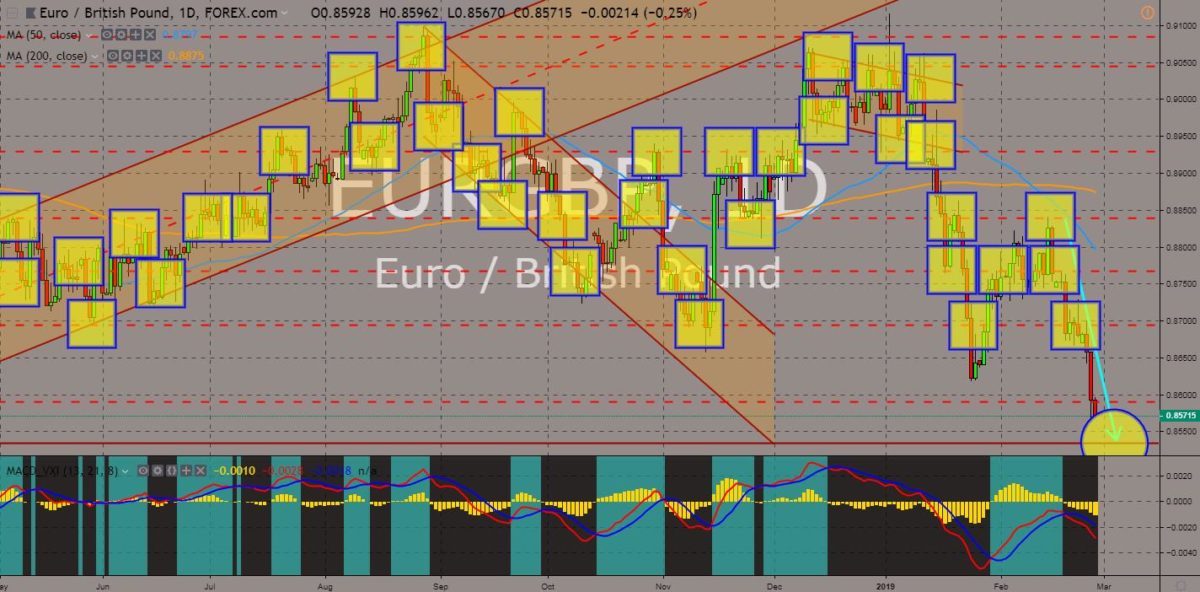
EURGBP
The pair will continue its steep decline following the formation of the “Death Cross”. Only 30 days remain before the United Kingdom will officially leave from the European Union. In her last attempt to secure a deal that will be approve by the EU and the UK Parliament, UK Prime Minister Theresa May took a U-turn, giving the MP’s a choice to decide the future of the UK. PM May said that she will present her last deal on May 14, 15 days before the deadline. If the deal will be turned down by the MP’s, May’s last resort would be to ask for an extension of the Article 50 from the UK Parliament, or the United Kingdom will crash out of the EU without a deal, putting the pressure to the MPs. Aside from Brexit, the European Union was also struggling with the rising Nationalism inside the bloc and they’re turning to the United Kingdom for an alliance. Histogram and EMAs 13 and 21 will continue its steep decline.
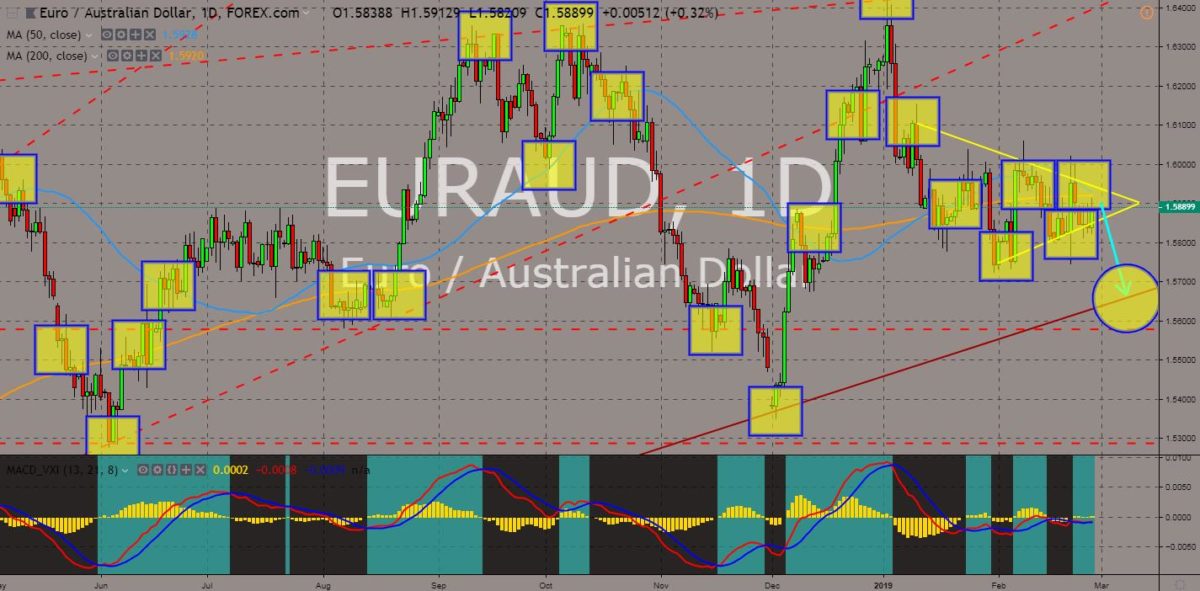
EURAUD
The pair was seen to break down of the “Triangle Pattern” and go down towards a major support line following the impending cross over between MAs 50 and 200, which create the “Death Cross”. Germany, France, and the United Kingdom are the three (3) biggest economy in Europe, however, the divorce between the United Kingdom and the Franco-Germano led European Union will mean that these parties will take different paths. The European Union secured the ratification of the EU-Japan Free Trade Deal, while restricting Australia’s agricultural imports, another regional power in Asia Pacific. The United Kingdom on the other hand, signed a post-Brexit trading agreement with Australia, while making Japan wait for its withdrawal before the two can talk about a post-Brexit trading agreement. Histogram and EMAs 13 and 21 was expected to reverse in a buying pressure in the following days.
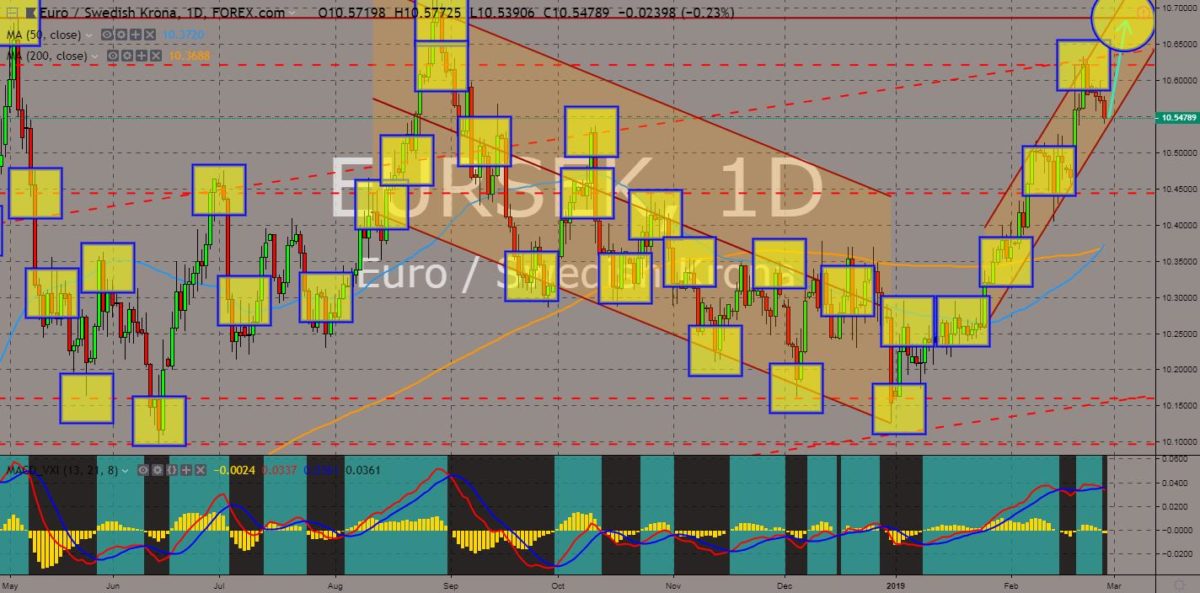
EURSEK
The pair was intact in an uptrend channel and was expected to rally with the crossed over between MAs 50 and 200 that resulted to a “Golden Cross”. The United Kingdom seemed to choose a Switzerland-style Brexit rather than the Norway-Plus Brexit. The United Kingdom rejected being a member of the EU’s Customs Union and Single Market. Switzerland is not a member of the European Union neither the EU’s Customs Union nor Single Market, but its relationship with the bloc was formed through a series of bilateral trade agreements. The UK and Switzerland recently signed a post-Brexit trading agreement that ensures the continuity of their trading relations. However, for Switzerland choosing the United Kingdom over EU means that it will face difficulties dealing with the European Union. Histogram and EMAs 13 and 21 will reverse in the following days.


COMMENTS