

Here are the latest market charts and analysis for today. Check them out and know what’s happening to the market today.
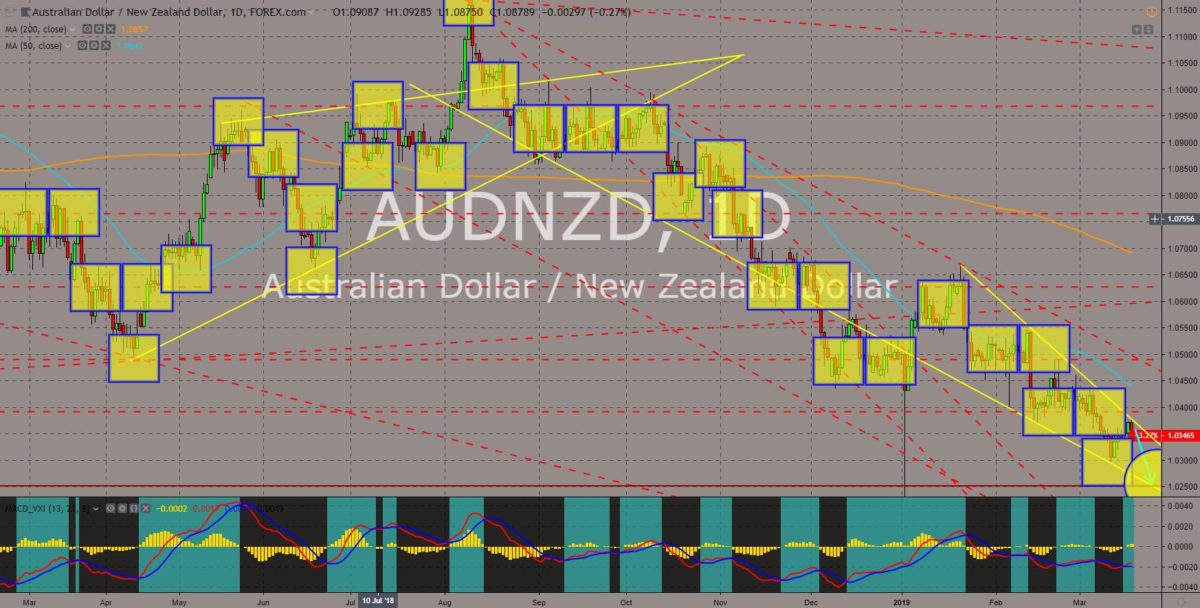
AUDNZD
The pair was expected to further go lower in the following days after it failed to break out of the “Falling Wedge” pattern. The relationship between Australia and New Zealand was on its lowest following the bombing of a mosque in Christchurch, New Zealand. It was already confirmed that the gunman came from Australia with previous criminal records. White Supremacism was common in Australia as the country was a previous British colony together with New Zealand. However, unlike Australia, New Zealand retain its indigenous people with tanned skin color. The trade war between the United States and China pave way for the reshuffling of global order of dominance, where New Zealand was seen establishing its own identity apart from Australia. The two (2) countries were now competing to become the dominant power in the region. Histogram and EMAs 13 and 21 shows sign of reversal.
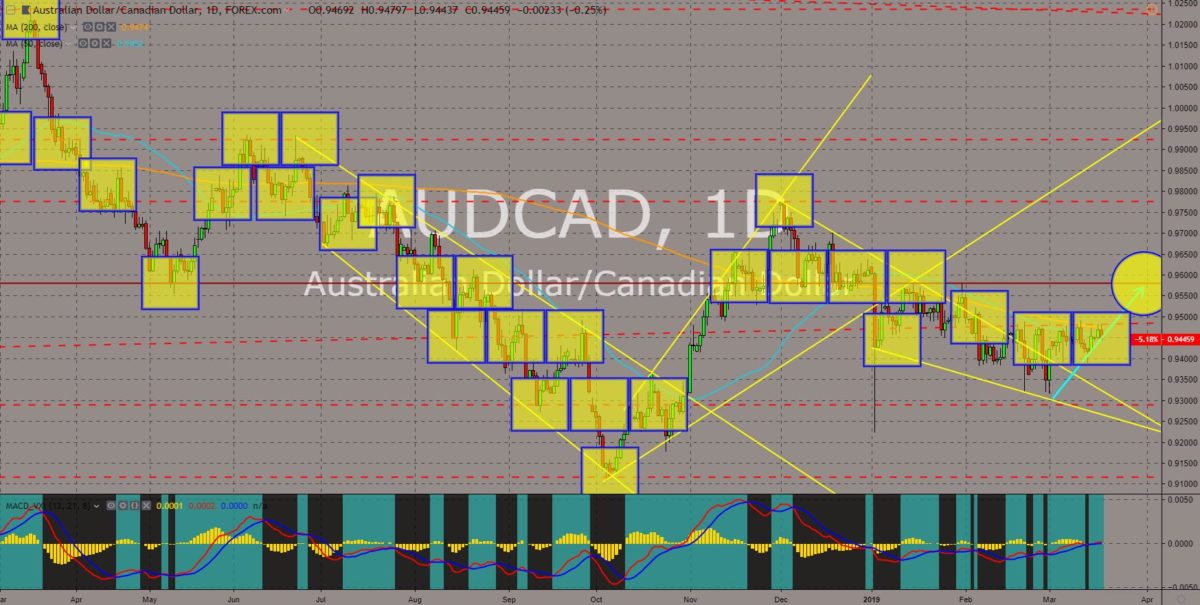
AUDCAD
The pair was seen consolidating after it broke out from the “Falling Triangle” pattern, which signals a future reversal for the pair. Australia was facing challenges inside and outside the country. Some of the members of the Australian Parliament was hacked ahead on the impending federal election on which the incumbent Prime Minister Scott Morrison was expected to lose, electing the 6th Australian Prime Minister in just a decade. Aside from that, the country was pressured from its close ally, the United States, regarding the banning of Chinese technology company Huawei. Canada was the only member of the Five Eyes Intelligence Alliance that didn’t ban the company. The European Union also imposed additional tariffs to the country after it signed a post-Brexit agreement with the United Kingdom. It also entered its first recession in 30 years. Histogram and EMAs 13 and 21 successfully crossed over.
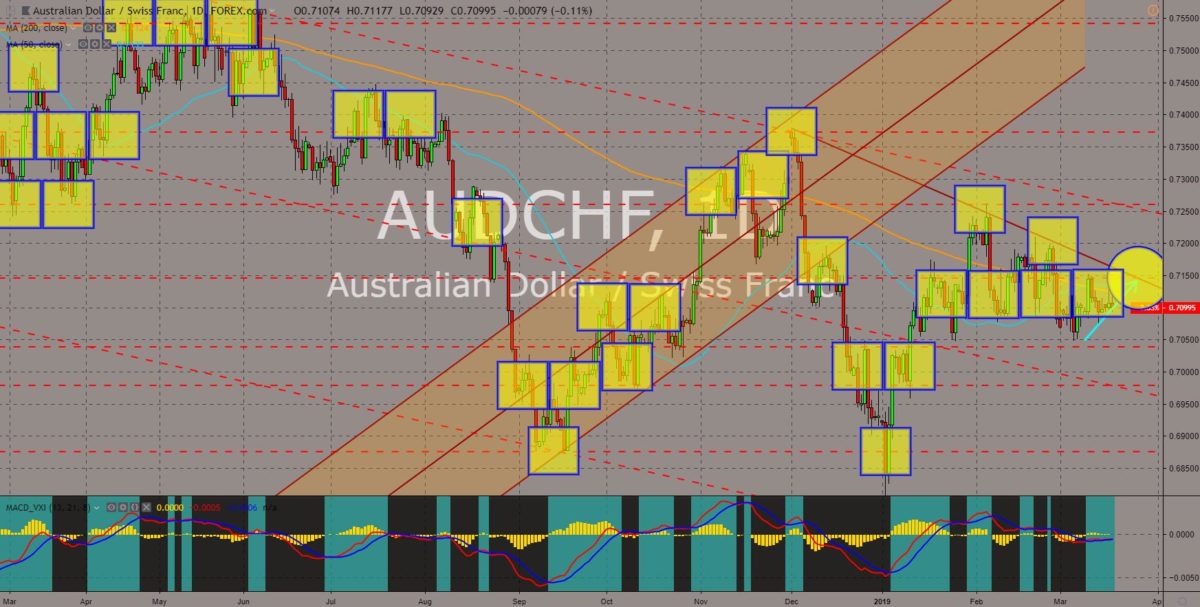
AUDCHF
The pair was set to retest the downtrend resistance line following the formation of the “Golden Cross”. Despite the uncertainty surrounding the Brexit, the United Kingdom had lobbied its allies to sign a post-Brexit trading agreement, which ensures a trade continuity between their countries. The UK look towards its previous colonies – Canada, Australia, and New Zealand, non-EU members (Switzerland and Norway), and even the anti-EU nations like Hungary, Poland, Czech Republic, and the Slovak Republic. However, this was not well received by the European Union who also maintains a bilateral trade agreement with these countries. The EU had banned Australia from naming its products with the same name from EU’s local products. It also pressured Switzerland to sign the framework deal, which incorporates all its bilateral agreements with the country. Histogram and EMAs 13 and 21 will continue moving upwards.
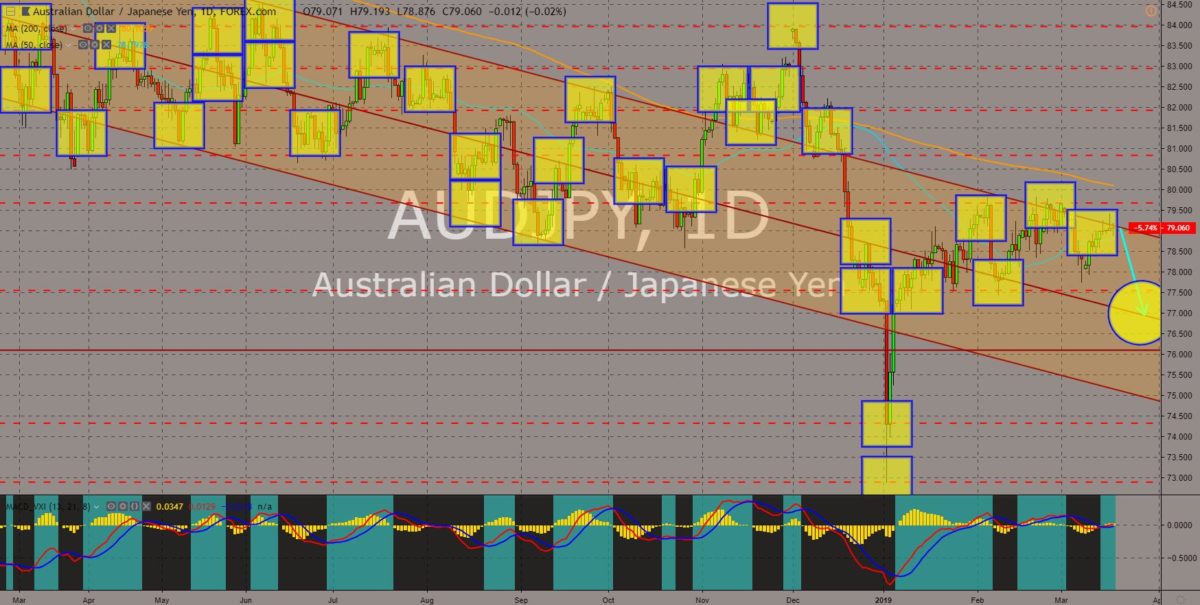
AUDJPY
The pair was currently trading on the downtrend channel resistance line, but the “doji candle” formation on the resistance hints a future reversal. Australia, Japan, and India, were viewed as a regional power in Asia, and with the inclusion of the United States, these four (4) countries formed the “Asian NATO”. Despite being allies, Japan and Australia were competing to dominate the Asia Pacific. The two (2) countries were part of the ASEAN (Association of South East Asian Nation) with Japan on the “ASEAN Plus Three” and Australia on the “ASEAN Plus Six”. They also lead the CPTPP (Comprehensive and Progressive Trans-Pacific Partnership). However, Australia was facing challenges, which could spell out its future relevance in the global stage as its neighbor New Zealand was seen establishing its own influence in the region. Histogram and EMAs 13 and 21 was expected to fall lower in the following days.


COMMENTS