

Here are the latest market charts and analysis for today. Check them out and know what’s happening to the market today.

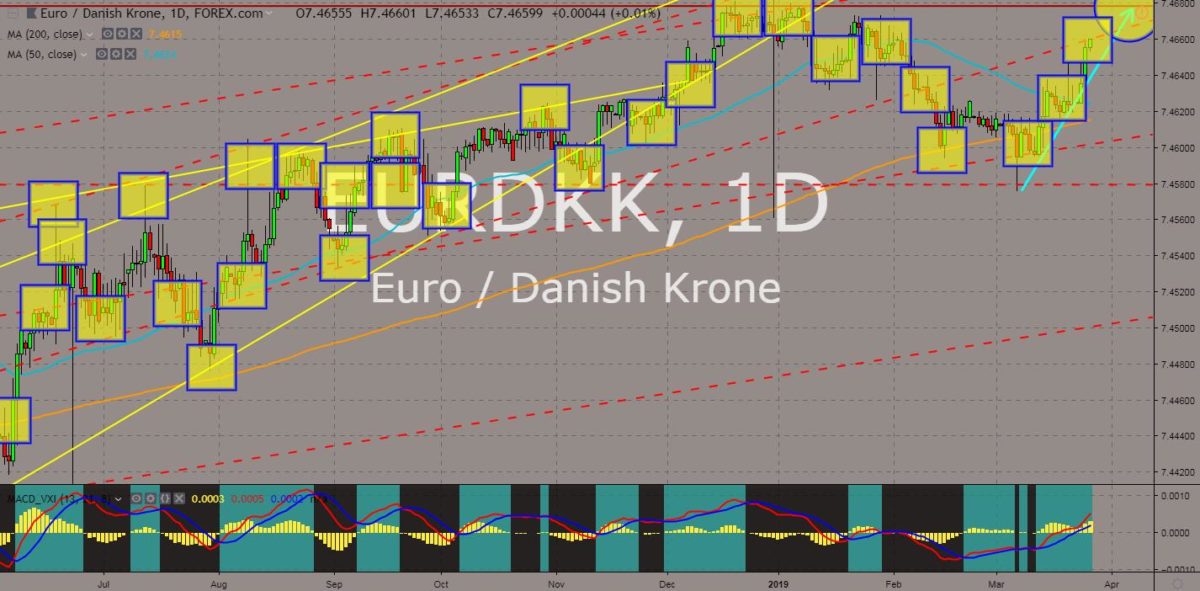
EURDKK
The pair was seen to continue its rally to retest its previous high, while MAs 50 and 200 indicates a possibility of a formation of the “Death Cross”. Denmark Prime Minister Lars Løkke Rasmussen says that the European Union should choose a liberal economy over China’s model, that the EU must resist French President and EU’s de facto leader Emmanuel Macron’s effort to “politicize” the Single Market or “copy and paste the Chinese model” of state intervention. This was after the President Macron and the former EU’s de facto leader and German Chancellor Angela Merkel hosted Chinese President Xi Jinping’s visit to Europe. The European Union was trying to establish its relationship with China following the narrowing gap in its relationship with the United States. Denmark was seen to fill the United Kingdom’s role in the power balance inside the EU. Histogram and EMAs 13 and 21 will continue to go up.
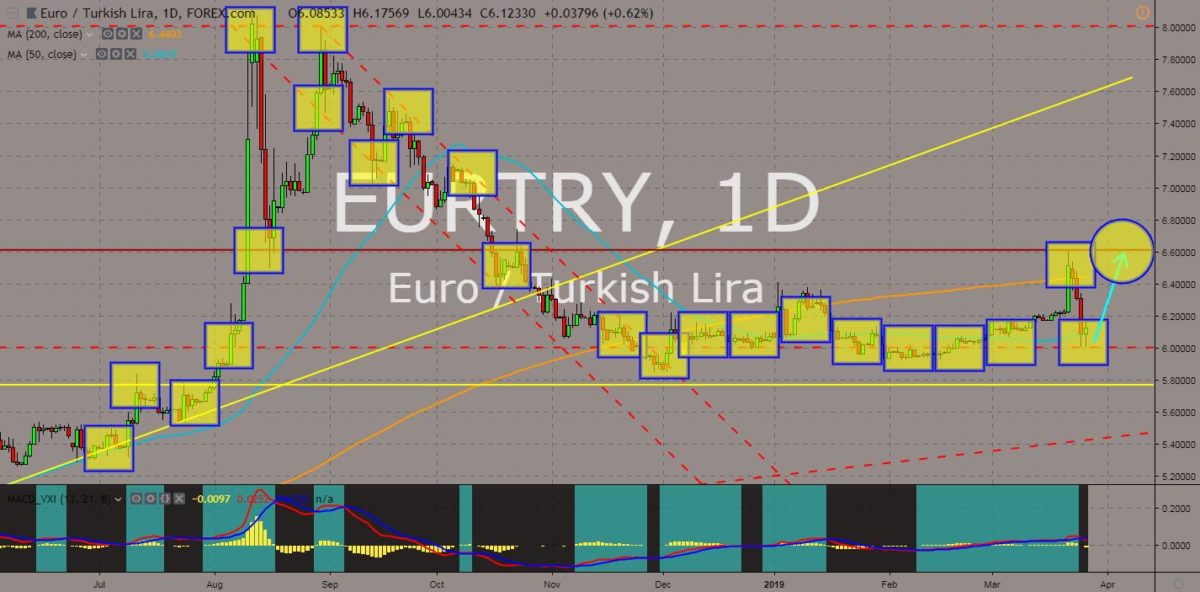
EURTRY
The pair found a strong support on its “wick” from a major support line and the candle’s body on 50 MA, which will send the pair higher towards its previous high. The European Union held a non-binding vote to suspend Turkey’s accession in the European Union. Turkey was already inside the EU’s Customs Union, but will need to integrate its economy on the Single Market. Turkish President Recep Tayyip Erdogan was accused of power concentration after he successfully changed the constitution to change the Parliamentary system to Presidential system, giving him more power to elect the heads of Turkish institutions. The European Parliament also voted against Turkey’s upcoming nuclear power plant in its bid to become independent from the US led NATO (North Atlantic Treaty Organization) Alliance as the country will purchase a Russian defense system. Histogram and EMAs 13 and 21 was expected to reverse.
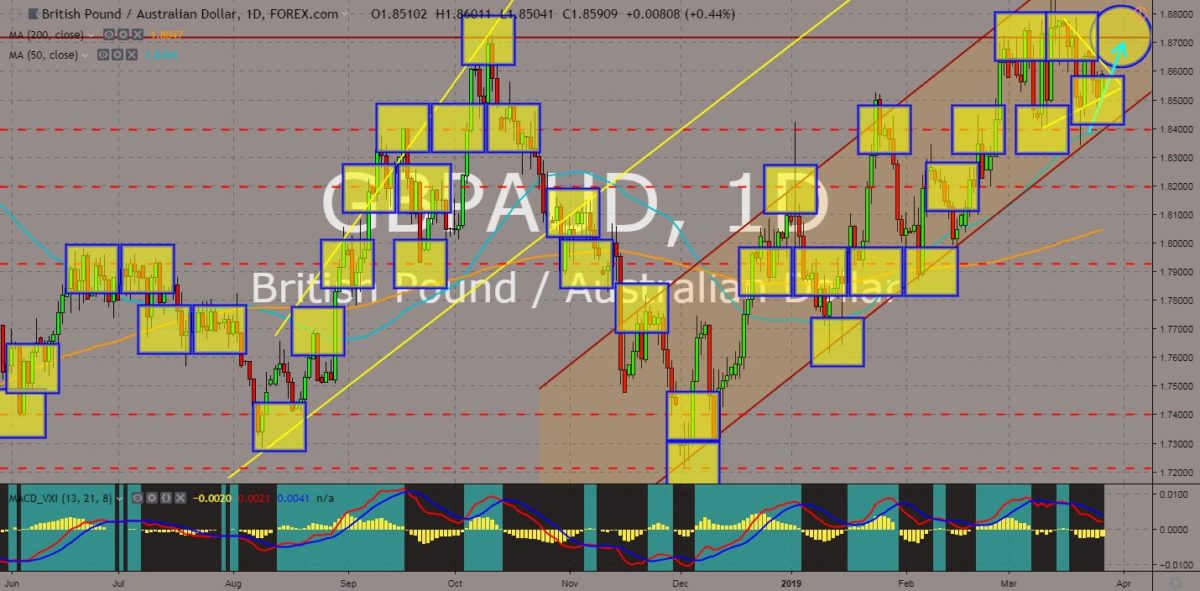
GBPAUD
The pair was expected to break out of the “Pendant Pattern” and retest its nearest resistance line before heading towards the uptrend channel resistance line. Australia signed a post-Brexit trading agreement with the United Kingdom as the UK was trying to flex its influence towards its former colonies in its bid to counter the European Union. The European Union on the other hand, had ratified its Free Trade Agreement with Japan, which created the largest trading zone in the world. However, the relationship between the United Kingdom and Australia might hurt these two (2) countries as Australia just entered a recession for the first time in thirty (30) years and will face a looming federal election, while the United Kingdom‘s future was still in dim as UK Prime Minister Theresa May was having a hard time to convinced the UK Parliament with her deal. Histogram and EMAs 13 and 21 was already shifting towards a bullish pattern.
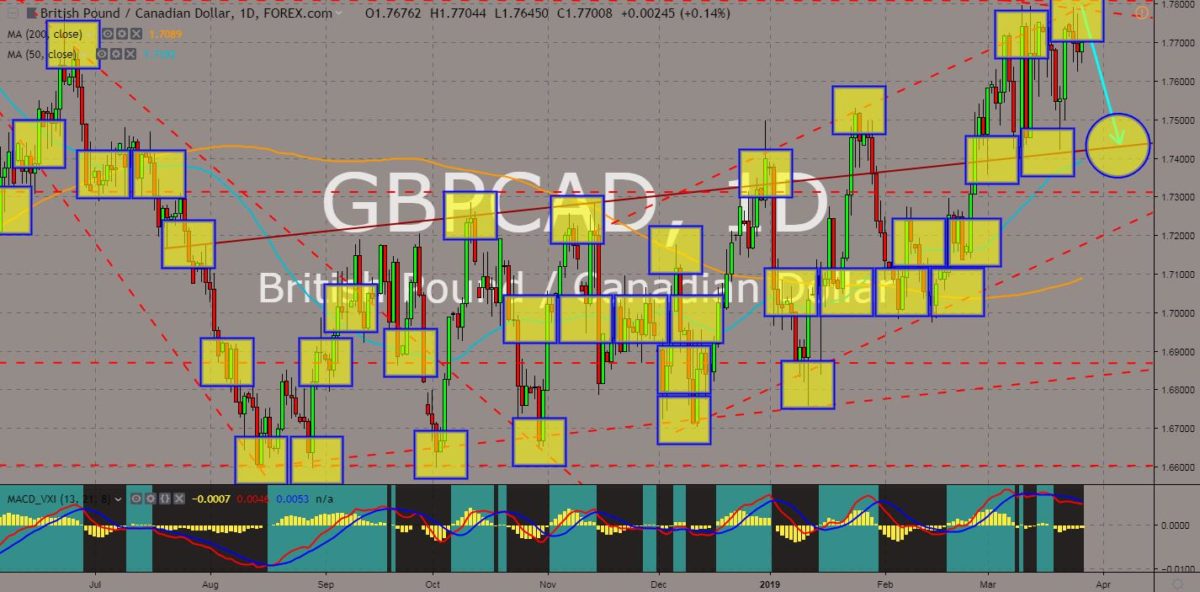
GBPCAD
The pair was topped by three (3) resistance lines at the same time – an uptrend channel resistance, a downtrend channel resistance, and a major resistance line. The United Kingdom was seen to lose on the tug-of-war with the European Union. As the UK was set to depart from the EU on March 29, it began signing a post-Brexit trading agreement with non-EU members in Europe and with its former colonies, the CANZUK (Canada-Australia-New Zealand-United Kingdom) for trade continuity purpose. However, New Zealand earlier said that the country’s decision will be independent from the United States and the United Kingdom’s influence. Canada on the other hand, had saw an increase on its agricultural export with the European Union to double in 2018. Canada’s call for the release of its citizens held in China was also supported by the EU. Histogram and EMAs 13 and 21 will continue to fall lower.


COMMENTS