

Here are the latest market charts and analysis for today. Check them out and know what’s happening to the market today.
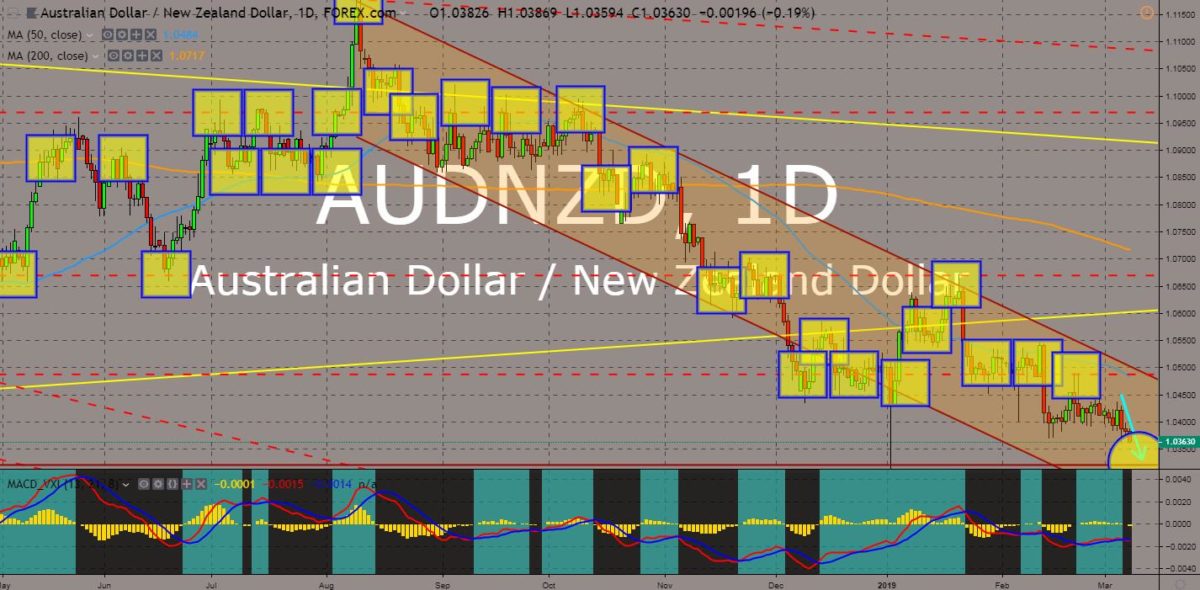
AUDNZD
The pair was still intact on the downtrend channel after it failed breakout of the channel resistance line. The gap in the relationship between Australia and New Zealand were growing as the two (2) countries take different paths. Another evidence of this gap was the deportation of Kiwi nationals living in Australia, despite these people haven’t set foot in NZ since their birth. Only the United States and Australia were there remaining Five Eyes Intelligence Alliance members to stick on their decision to ban the Chinese technology company Huawei amid security concerns. The two (2) countries were also subject to the European Union and the United Kingdom’s plan to expand their influence in Asia. Australian Prime Minister Scott Morrison and New Zealand Prime Minister Jacinda Ardern met in New Zealand to discuss strengthening their relationship. Histogram and EMAs 13 and 21 was already in a selling pressure.
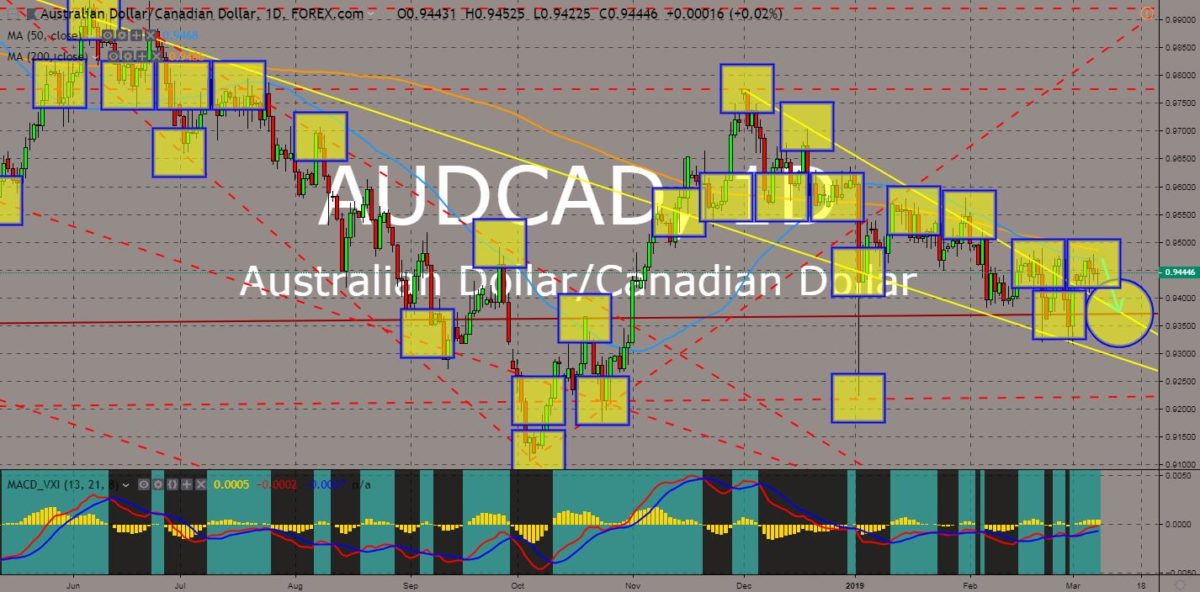
AUDCAD
The pair failed to sustain its strength after it broke out of the “Falling Wedge” pattern, but was immediately stopped by MAs 50 and 200, which acted as a support line. The trade war between the United States and China had reshuffled the world order. The once prosperous Canada was now struggling after the United States ratified the NAFTA (North America Free Trade Agreement), which increased Canadian export tariffs to the United States. The US also pressured the country to arrest the Chinese technology company Huawei, which caused the relationship between Canada and China to fall. The same thing was happening to Australia who banned Huawei in building the country’s 5G (Fifth Generation) network amid US Pressure. Now, Australia entered its first recession in 30 years (in terms of GDP per capita). Histogram was seen weakening, while EMAs 13 and 21 was expected to reverse in the following days.
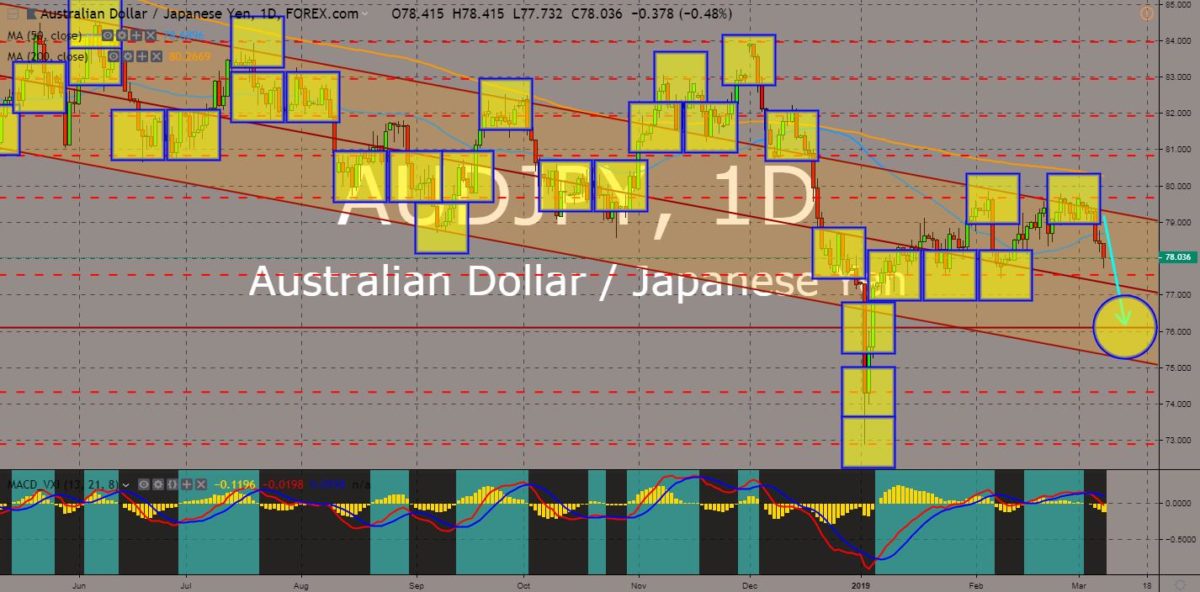
AUDJPY
The pair will continue its steep decline after it failed to break out from two (2) major resistance lines. Australia and Japan were two (2) regional powers in Asia Pacific and was leading the efforts to strengthen the pacific rim trade pact, the CPTPP (Comprehensive and Progressive Trans-Pacific Partnership) after the United States pulled out in 2017. The two (2) countries were also subject to the European Union and United Kingdom’s competition to further expand their influence in the East. The European Union ratified the EU-Japan Free Trade Deal, which created the largest trading zone in the world, while the United Kingdom signed a post-Brexit trading agreements with its former colonies – Australia, Canada, and New Zealand. Between the two (2) countries, however, Japan is more powerful with its economic and military might than Australia. Histogram and EMAs 13 and 21 already crossed over signaling a downward movement.
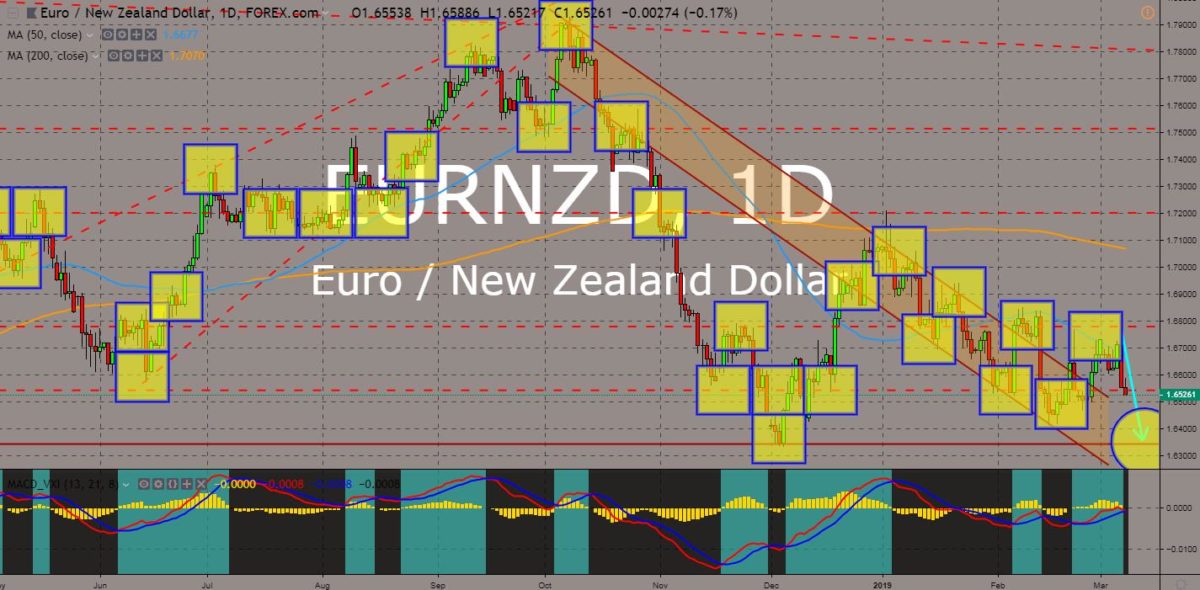
EURNZD
The pair was seen to enter its 4-month low following its failed breakout from 50 MA that caused the pair to move lower. New Zealand was seen to be the winner with the withdrawal of the United Kingdom from the European Union. New Zealand was the first country to express its willingness in making bilateral trade agreement with the UK once it officially withdraws from the bloc, despite having an existing free trade agreement with the European Union. Australia followed the same move by New Zealand but had received retaliation from the EU. The United Kingdom signed a post-Brexit trading agreement with Australia and New Zealand, while the European Union ratified its existing free trade agreement with Japan and allied with New Zealand amid the growing gap between the relationship of Australia and New Zealand. Histogram and EMAs 13 and 21 was seen to cross over.


COMMENTS