

Here are the latest market charts and analysis for today. Check them out and know what’s happening to the market today.

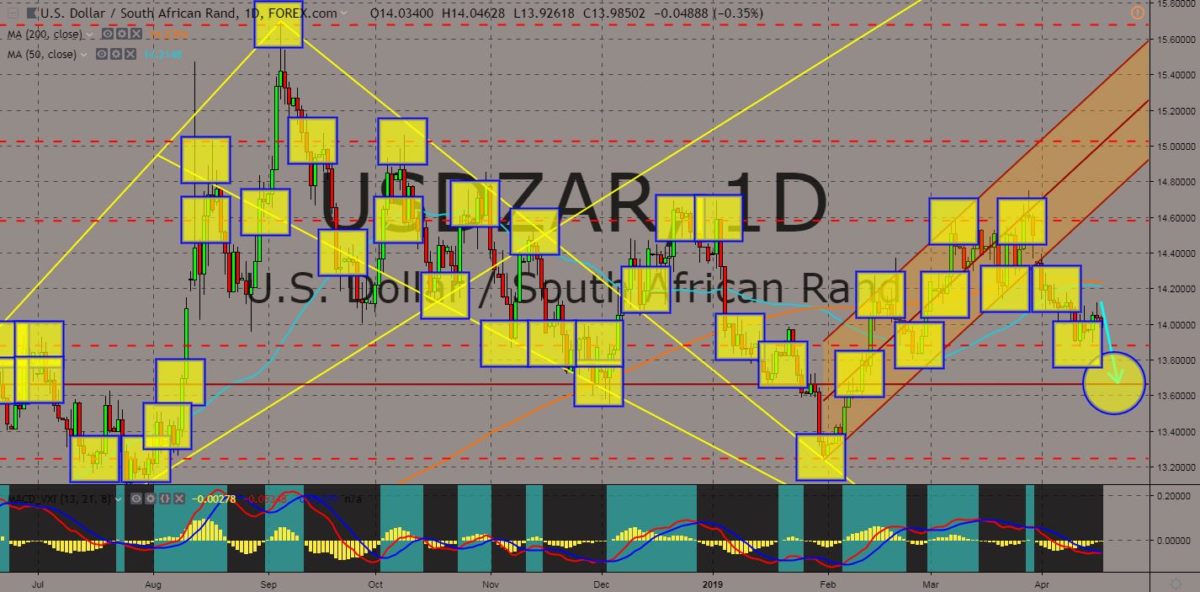
USDZAR
The pair was seen to continue going down in the following days after MAs 50 and 200 failed to crossover. South African Rand was being lifted by the growth of Chinese economy. With most African nations being indebted to China, the chances of making loan and repaying them in Chinese Yuan increases. This will further boost the demand for the Chinese currency and might overthrow the United States Dollar as a global reserve. Russia was also dumping its US Dollar reserve to get rid of its reliance from the currency. Having South Africa on China’s side is like having then African Union siding with China. This can also be seen as strengthening the relationship among BRICS (Brazil-Russia-India-Canada-South Africa) members. Sri Lanka was one of the countries which defaulted on its Chinese loan. Sri Lanka leased its biggest port to China on a 99-year leased. Histogram and EMAs 13 and 21 was expected to fail to crossover.
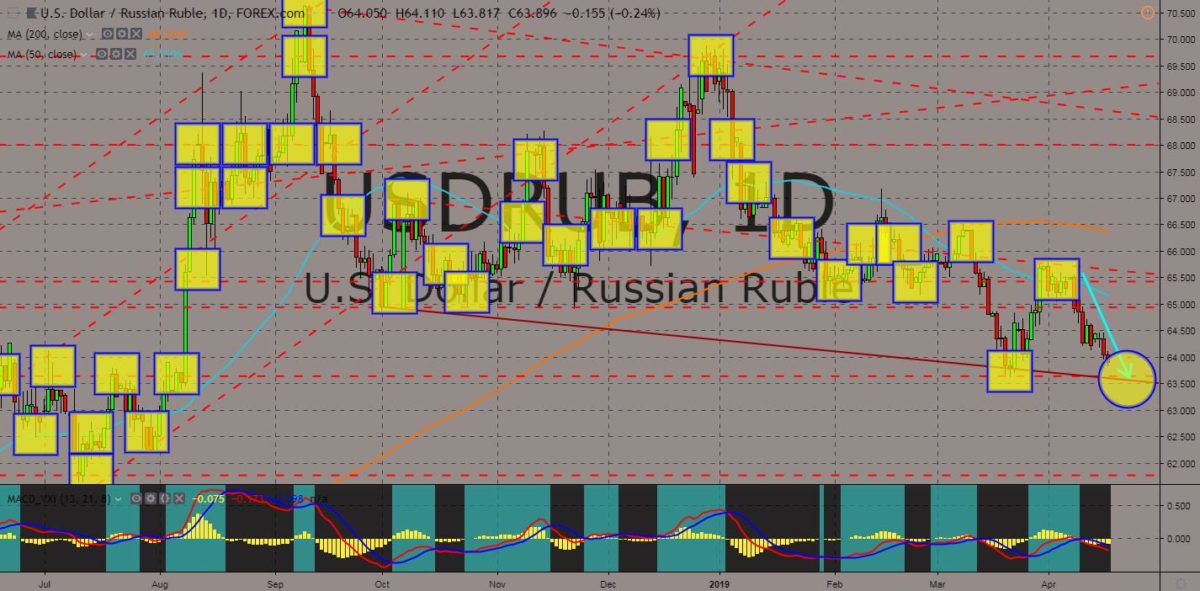
USDRUB
The pair failed to break out from 50 MA, sending the pair lower to the nearest support line. The United States and Russia pulled out from the 1987 nuclear pact treaty, the INF (Intermediate-range Nuclear Forces) last February. The withdrawal of the two (2) nuclear armed countries threatened the possibility of a new era of Cold War. Russia had also surpassed the United Kingdom as the second largest manufacturer of military equipment after the US. Yesterday, April 16, Russia completes the delivery of SU-35 fighter jets to China. Turkey also said that its purchase of Russian S-400 ballistic missile defense system is already a done deal amid pressure from the United States. Turkey is a member of the NATO (North Atlantic Treaty Organization) Alliance, particularly the group’s defense sharing agreement, which will compromise NATO’s defense. Histogram and EMAs 13 and 21 will further go lower in the following days.
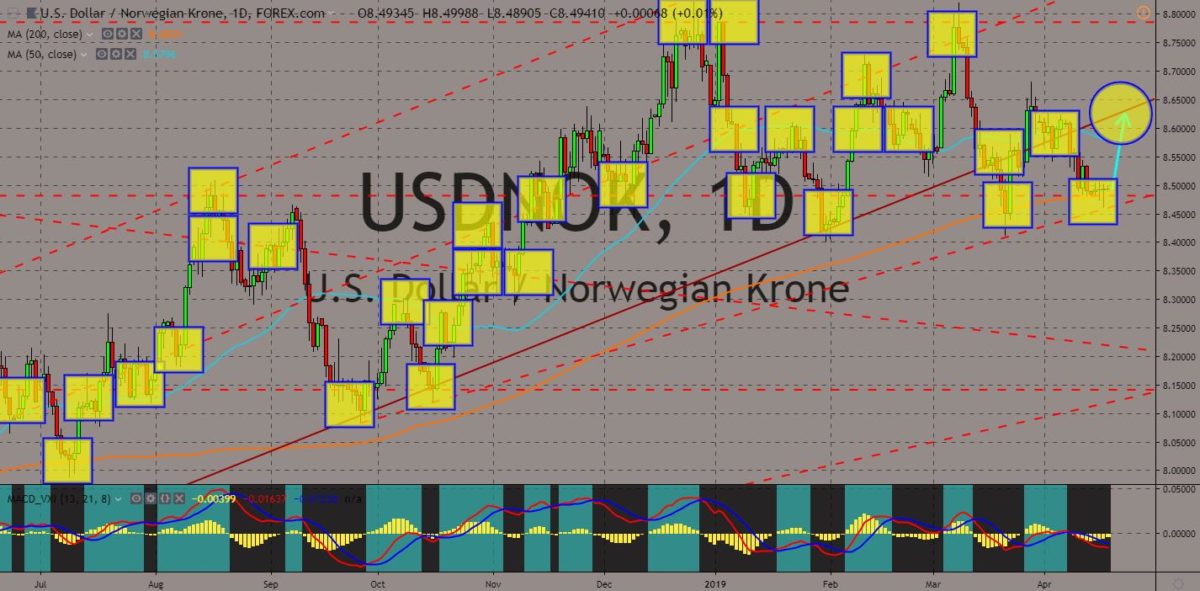
USDNOK
The pair was seen consolidating on a major support line, which will push the pair higher in the following days. With the withdrawal of the United States and Russia from the 1987 nuclear pact treaty, the INF (Intermediate-range Nuclear Forces), a new era of Cold War was brewing, and that could start in the Arctic region. The arctic ice was melting at a fast pace due to global warming and the Arctic Ocean will be a disputed area among countries surrounding it. Norway, the United States, Russia, Denmark, and Canada were the possible claimant of the new arctic territory. The US led NATO (North Atlantic Treaty Organization) Alliance includes Canada, Norway, and Denmark, and this could lead to the United States establishing a US base among the NATO members. Russia had already started to build military bases to look for evidence that will expand its territory in the Arctic. Histogram and EMAs 13 and 21 was seen reversing.
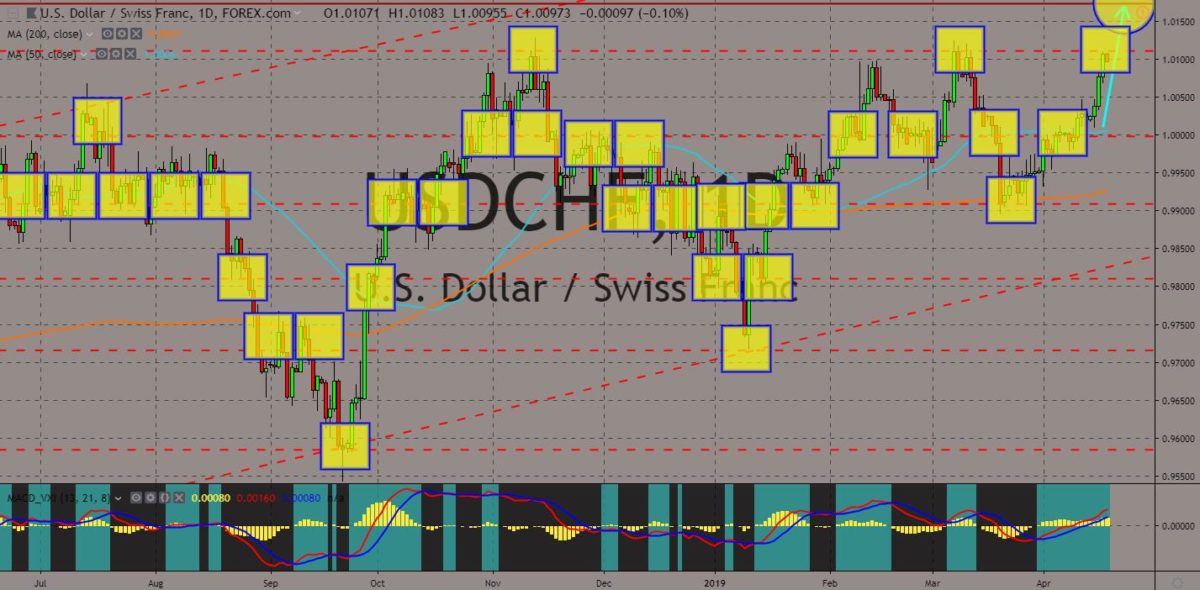
USDCHF
The pair was seen to continue its rally and break out from a major resistance line following its break out from 50 MA. The most neutral country in the world, Switzerland, signed an agreement to protect US interest in Venezuela. The Western countries considered the election win of Nicholas Maduro as a sham and had backed the self-proclaimed interim president of Venezuela, Juan Guaido. The United States was also in talks with Brazil to use military intervention in Venezuela to oust the Maduro government. Switzerland was among the countries who signed the post-Brexit trade agreement with the United Kingdom. The UK was also in talks with the United States to strike a bilateral trade agreement. The growing relationship between the United Kingdom and Switzerland had angered the European Union after Switzerland ignored the bloc’s framework deal. Histogram and EMAs 13 and 21 was poised to further go up.


COMMENTS