

Here are the latest market charts and analysis for today. Check them out and know what’s happening in the market today.

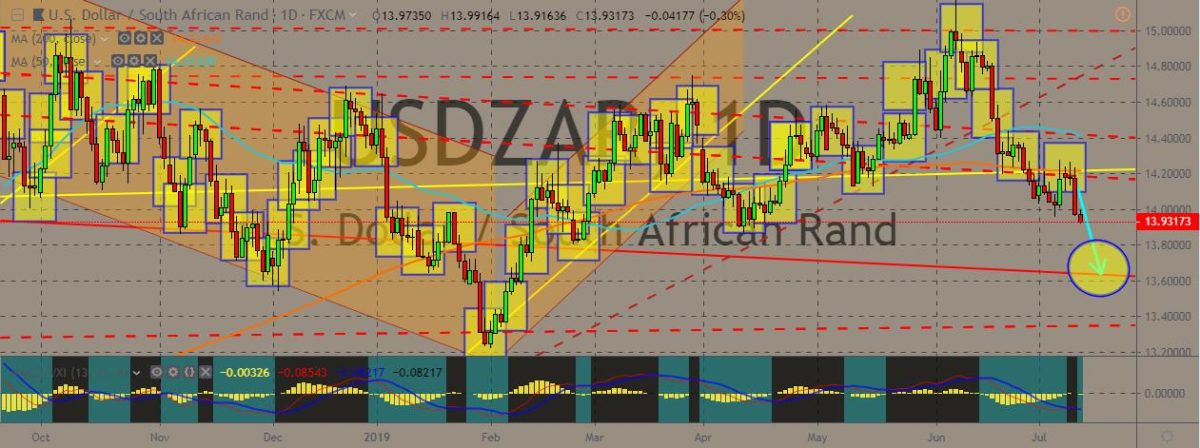
USDZAR
The pair is trading lower and approaching a solid support line, which, if it breaks it, will probably become a resistance line. On the daily charts, the 50- and 200-day moving average are also showing signs of convergence, even though the 50-day MA is still above the 200-day counterpart. The candlesticks are seen below the two MAs, meaning a bearish trend might persist. US Federal Reserve Chairman Jerome Powell gave signals last Wednesday that the US central bank is readying to provide lower borrowing costs for the first time in a decade. This is one good reason for emerging market central banks to also cut rates. Meanwhile, South African President Cyril Ramaphosa has re-appointed central bank governor Lesetja Kganyago for another five-year term when his current term finishes in November, according to the country’s finance ministry.
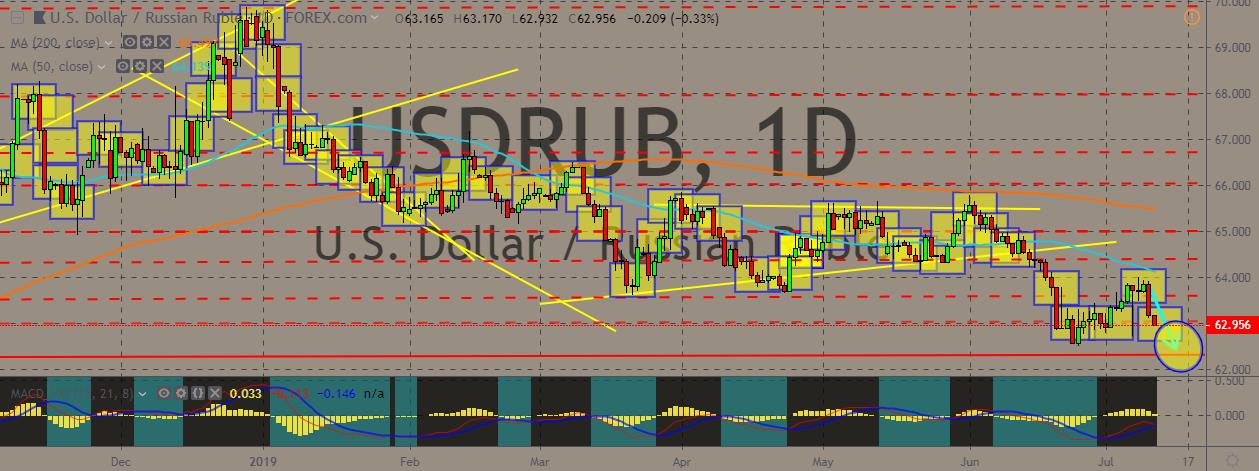
USDRUB
The pair recently bounced off from multi-months low but still suffers from sudden pullbacks downward. It is now trading lower again, crossing the solid support-line-turned-resistance level. The 200-day MA is still above the 50-day MA and the pair is trading below these averages, indicating a strong bearish trend ahead. Senior US diplomat David Hale recently held talks with Russia’s deputy foreign minister, Sergei Ryabkov, in Helsinki on Wednesday to discuss US-Russian relations, according to the State Department. The two countries have been embroiled to tensions for a long time now due to a variety of issues. This meeting comes after the meeting between US President Donald Trump and Russian President Vladimir Putin on the sidelines of the G20 summit in Osaka, Japan. Among the issues that the two countries are facing are the Syrian conflict, Crimea annexation, and the allegations of Russian meddling in US elections.
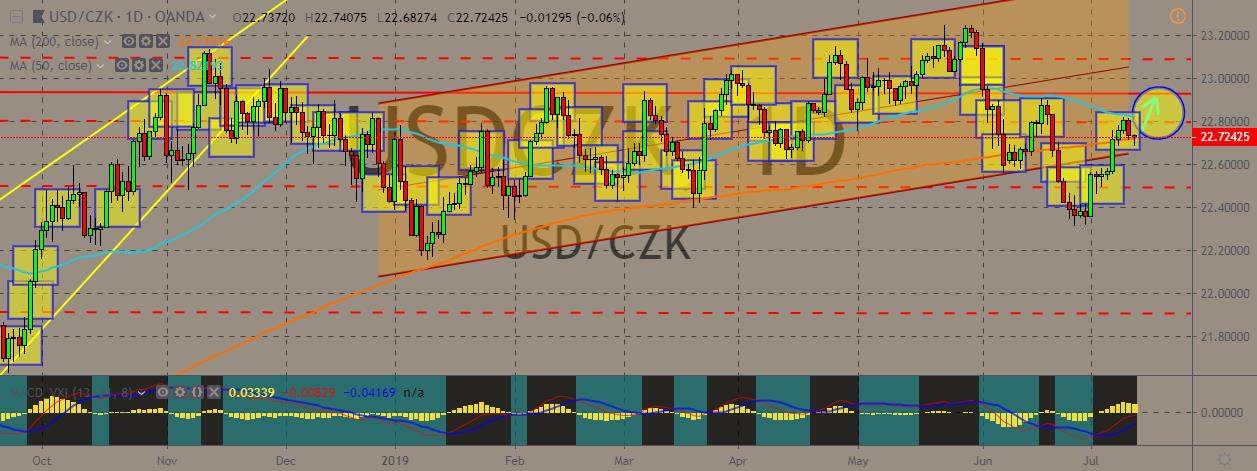
USDCZK
The pair recently went off its trading channel but eventually hopped back into the middle of the 50- and 200-day MAs, with the shorter terms line just above the longer term average, indicating a bullish trend. If the pair manages to perk up and jump above the middle line of the channel, it could extend its rally. In the Czech Republic, the Czech Statistical Office released preliminary data that showed the country’s foreign trade surplus increased in May by 17.2 billion crowns in annual measure. Exports increased year-over-year by 6.1% to 332.5 billion crowns. Imports gained 2.5% to 308.2 billion crowns. The influence on the movement of the balance came mainly from the motor vehicle sector, where exports jump by 11.5 billion crowns. On top of that, the deficit in refined petroleum products, chemicals, and oil and natural gas diminished. Recently, Prague also attended a Czech-UAE Business Forum.
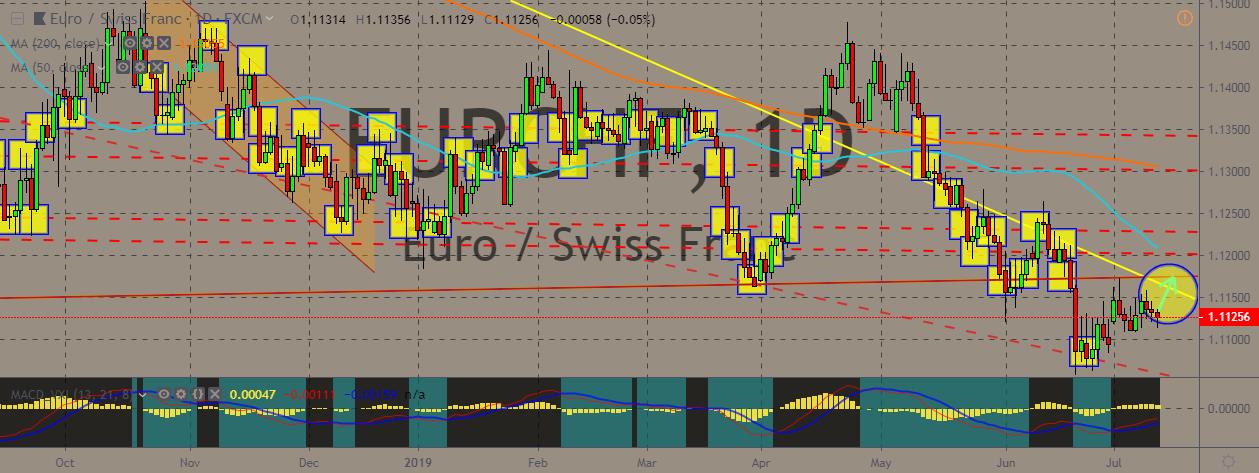
EURCHF
The pair is apparently stuck in tight ranges after a gap in the recent weeks, with the overall trend since its monthly lows generally upwards. Traders appear to be cautious in trying to bet too much for the euro given the impending change in leadership in the European Central Bank, the EU’s deal (or lack thereof) with the UK in relation to Brexit, and the Italian budget crisis. The EU just slashed growth and inflation expectations for the next year as trade tensions and policy uncertainty weigh on the region. This strengthened Mario Draghi’s case for further stimulus. Meanwhile, European traders have been banned from trading stock in hundreds of Swiss companies from Monday after a breakdown of treaty talks between Switzerland and the European Union. Swiss regulators have slapped a ban on EU exchanges after the European Commission allowed the ‘equivalence’ status given to the Swiss stock exchange to lapse.


COMMENTS