

Here are the latest market charts and analysis for today. Check them out and know what’s happening in the market today.

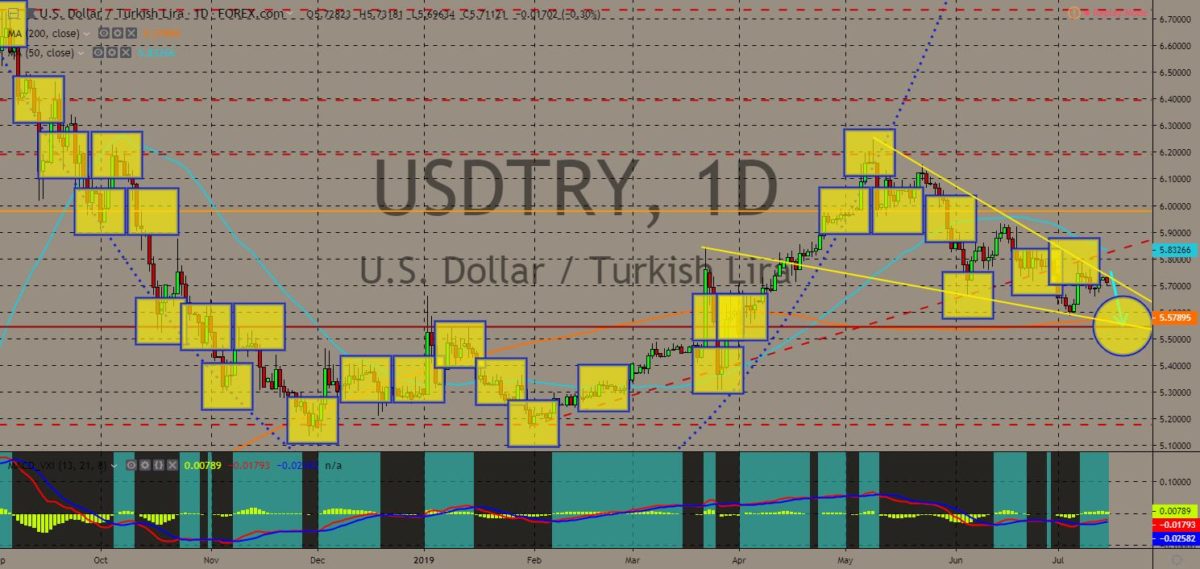
USDTRY
The pair failed to breakout from a “Falling Wedge” pattern resistance line, sending the pair lower towards its support. The United States offers is condolences to Turkey’s defeated coup victims as it commemorates the third anniversary of the failed Turkish coup attempt. The coup was meant to overthrow then Prime Minister Recep Tayyip Erdogan. Erdogan had successfully transitioned the country’s constitution from Parliamentary to Presidential, which gives him a sweeping power to elect heads of the institutions. In addition, the United States condemned Turkey’s action to halt its F-35 fighter jets purchase and instead bought Russia’s S-400 missile defense system. These purchase by Turkey threatened to compromise the defense sharing agreement of the NATO (North Atlantic Treaty Organization) Alliance. Histogram started to move down, while EMAs 13 and 21 was expected to reverse in the following days.
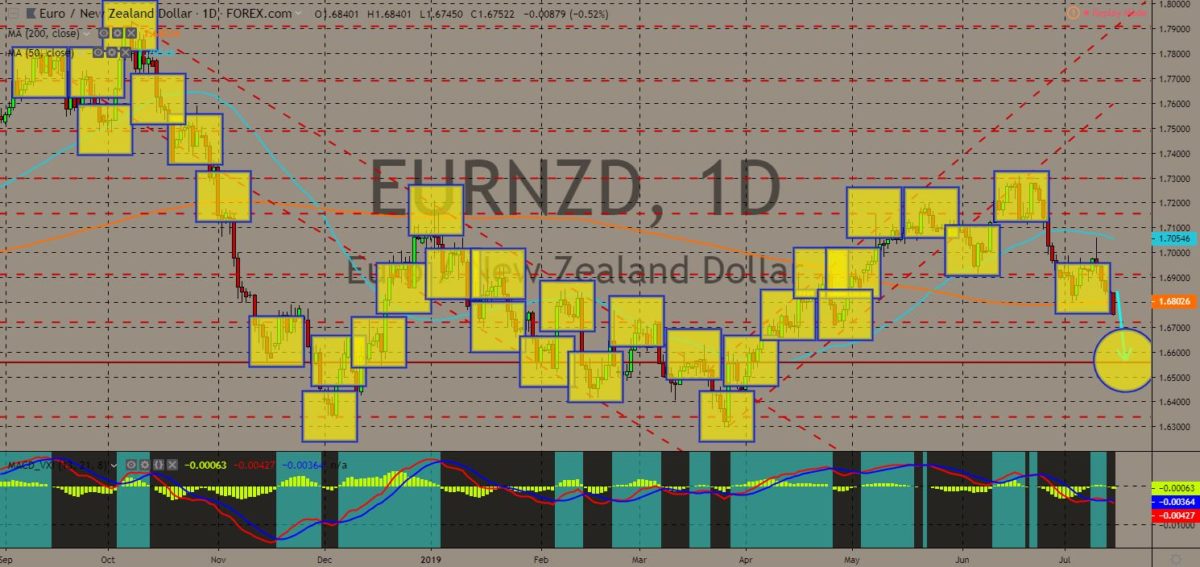
EURNZD
The pair will continue its steep decline after it broke down from 200 MA, which will send the pair lower towards a major support line. The European Union might lose its support from former British territories – Canada, Australia, New Zealand – after the United Kingdom published its temporary tariff rates, which covers nearly 87% of its goods. These tariffs were seen to encourage countries to sign trading agreement with the UK. This was the first time that the UK will negotiate its trade agreement following its accession to the European Union in 1973. Member countries loses their ability to trade when they join the bloc as EU institutions took over the role of trade negotiator between its members and non-EU countries. Aside from this, New Zealand Prime Minister Jacinda Ardern also look towards China to strike a bilateral trade agreement. Histogram and EMAs 13 and 21 will continue to move lower.
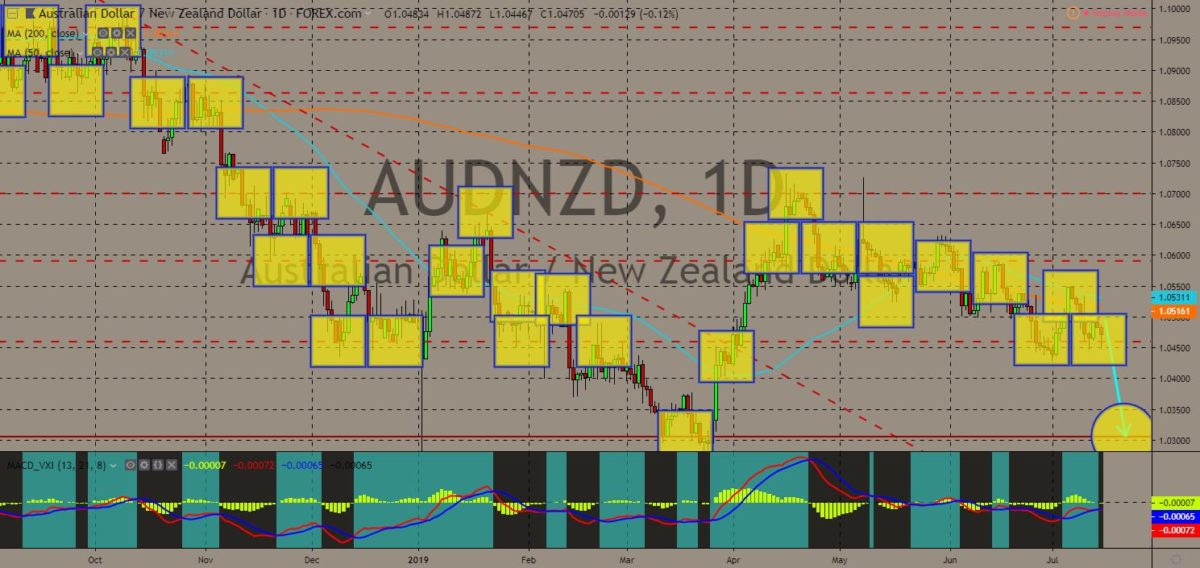
AUDNZD
The pair was expected to break down from a major support line, sending the pair lower towards its 4-month low. Australia and New Zealand shared a common history. They were two (2) former British colonies and are also members of the defense sharing agreement, the Five Eyes. Following the trade war between the two (2) largest economies in the world, United States and China, however, the two (2) countries had also started to diverge from each other. New Zealand shifted its foreign policy to a neutrality, abstaining from taking sides and had expressed that the country will never bow to any influence neither from the United States nor the United Kingdom. In line with this, New Zealand was the first country to sign a post-Brexit trade agreement, while maintaining its existing trade agreement with the European Union. Australia did the same thing but received retaliation from the EU. Histogram and EMAs 13 and 21 will reverse back.
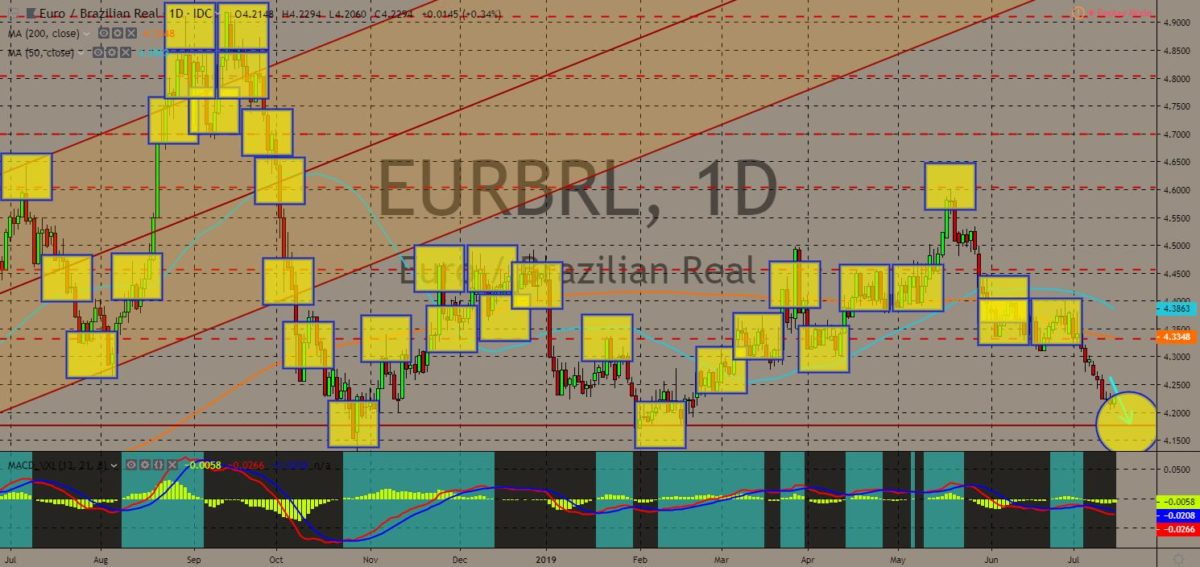
EURBRL
The pair was seen to continue its steep decline after it broke down from a support line, sending the pair lower towards a major support line. The European Union, the largest trading bloc in the world, and the Mercosur, the largest trading bloc in South America, have agreed to the draft of a free-trade treaty, ending almost 20 years of negotiation. The two (2) blocs began negotiating in 2000 and have intensified their efforts following the election of U.S. President Donald Trump during the 2016 Presidential Election. That push has seen the European Union implement a free trade agreement with Canada, Japan, and Mexico and now, after 39 rounds of talks, the EU has also reached a provisional deal with Mercosur, a grouping that consists of Argentina, Brazil, Paraguay and Uruguay. However, the draft deal still doesn’t ensure a trade agreement between the two (2) blocs. Histogram and EMAs 13 and 21 will continue to fall lower.


COMMENTS