

Here are the latest market charts and analysis for today. Check them out and know what’s happening in the market today.

EURUSD
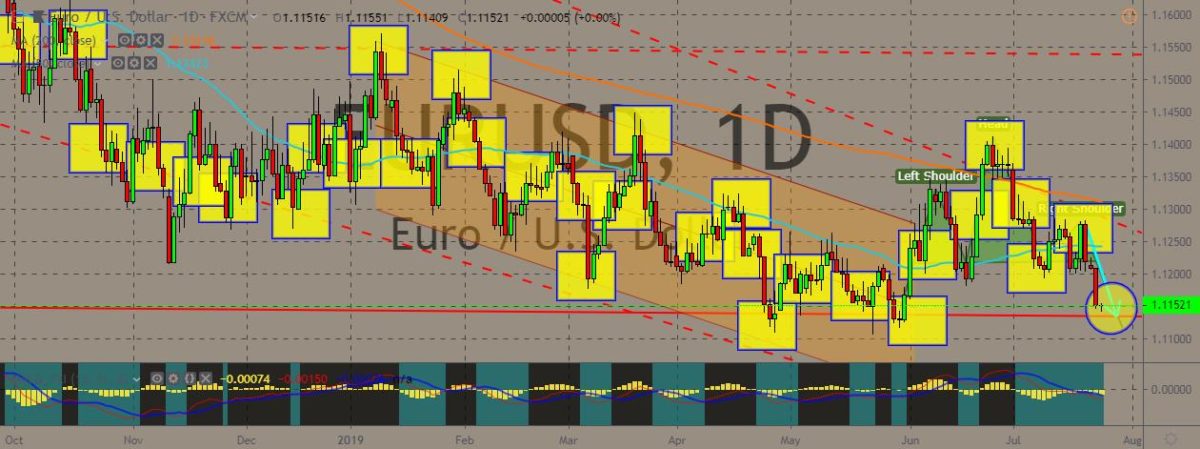
The euro pair just reached its two-month low against the dollar as pressures mount ahead of the highly anticipated meeting by the European Central Banks and amid hints of progress over the US-China trade war negotiations. The pair just showcased a head-and-shoulder pattern, with the right shoulder potentially plunging even deeper afterwards. The markets are already fully pricing in a potential quantitative easing. They expect possible additional rate cuts by the ECB although there would be no further rounds of easing. The euro’s downward spiral quickened as markets wait for the ECB’s policy meeting on Thursday. Markets expect a 10-basis-point cut by the bank, with a dovish guidance, as a preliminary preparation for easing in September. Overall, the market is awaiting more on how ECB President Mario Draghi will use language regarding the policy guidance.
USDJPY
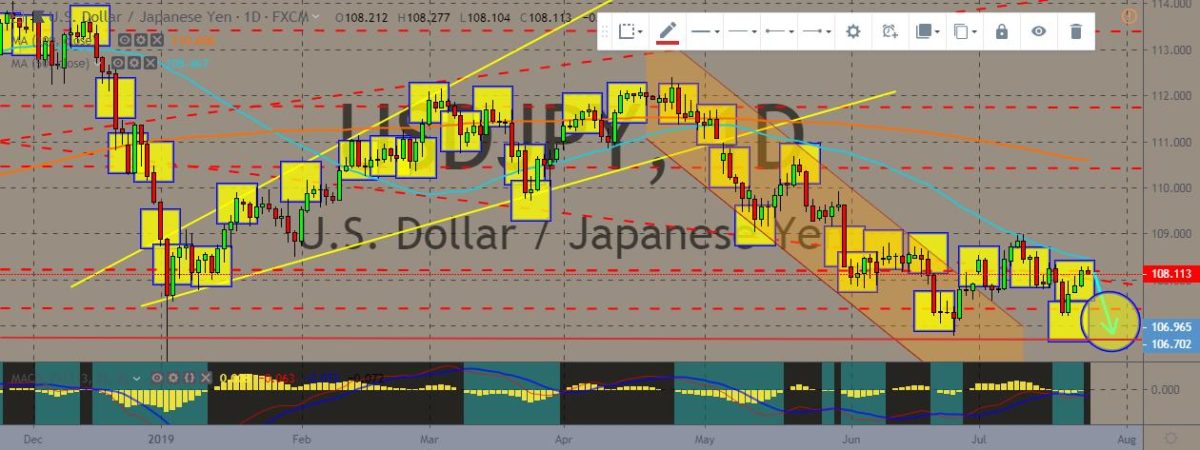
The pair is trading down for the day, although the dollar managed to finish the previous trading session positively. The pair is nearing the 50-day moving average, just below it, as well as below the 200-day moving average, indicating a bearish signal. The US dollar previously rose against various currencies after US President Donald Trump and US lawmakers hammered a two-year deal that increases the limits on government borrowing to cover spending. This agreement helped prevent another government shutdown. Previously, a December and January shutdown led to furlough of around 800,000 federal workers. The economy suffered about $3 billion. Because of the deal, the US Treasury can increase its short-term borrowing to improve a cash pile that has shrunk to around $195 billion from $423 billion in late April. The dollar also got its recent strength from the weakness in other majors, such as the euro and the British pound.
NZDCAD
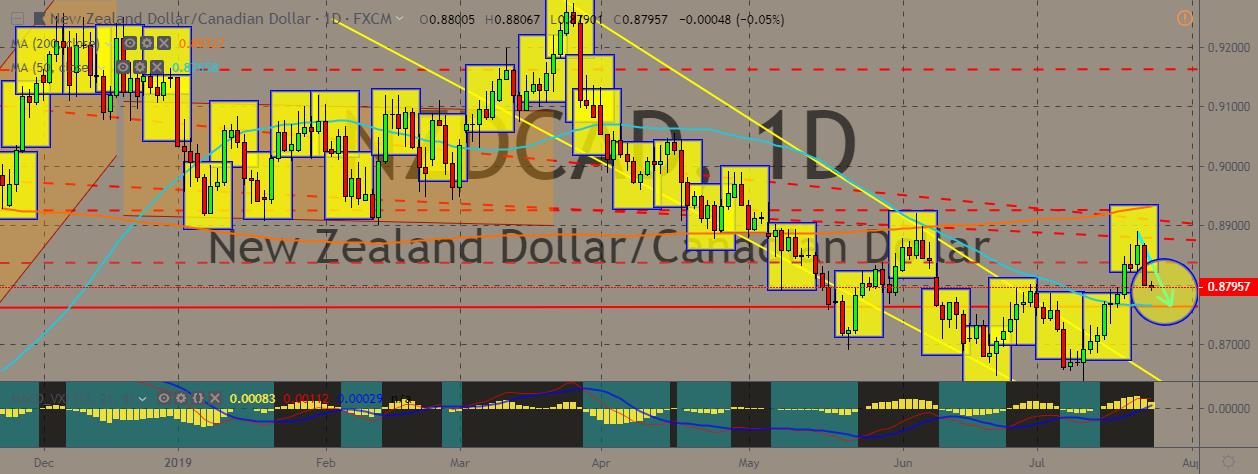
The pair plunged and crept towards the lower 50-day moving average, which is quite a way from the 200-day moving average, indicating that the bearish move could probably continue going on. This breaks the pair slow recovery from its plunge in early July. The kiwi plummeted after the Reserve Bank of New Zealand was reported to be considering how it would implement “unconventional” monetary policy measures. These include quantitative easing, and such a plummet came at the beginning of a practically important week for the forex markets. The RBNZ is changing its strategy for stimulating the economy if any event happens that forces it to adopt radical actions. This comes as the forex markets are trying to pinpoint which among the major central banks will win the “race to the bottom,” wherein the banks are moving towards interest rate cuts. Either that or the banks are preparing investors for such moves.
GBPUSD
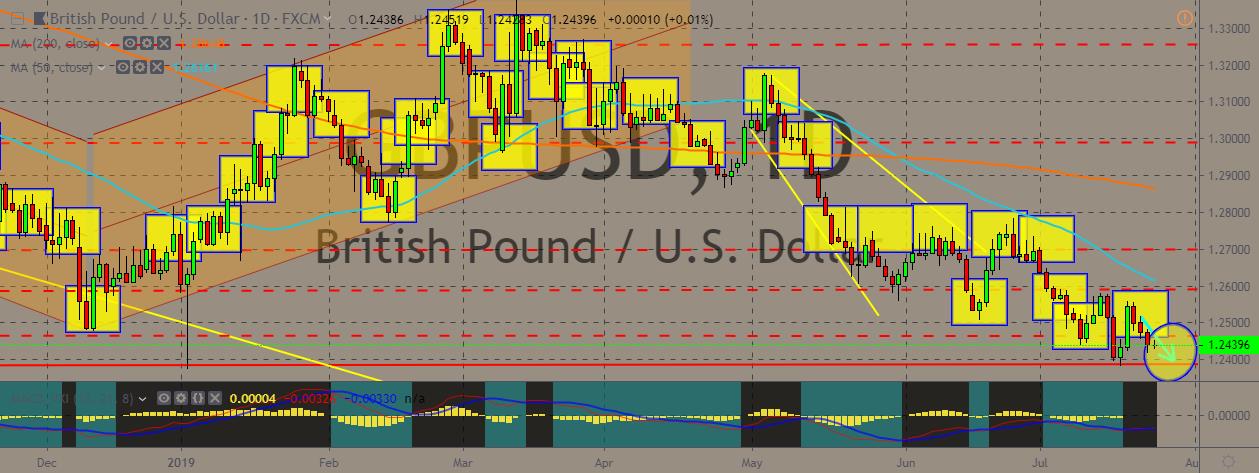
The pair traded a touch higher today, although it has more to go in terms of recovering its recent losses. The slight lift came from the victory of Boris Johnson as Britain’s new prime minister, although investors are significantly worried that he would drive Britain towards a no-deal Brexit. However, the move is minimal and is probably just a relief-rally after weeks of uncertainty as markets anticipated his victory. The focus now shifts towards how many ministers will oppose Johnson’s tough line on Brexit, and who among those will resign in the coming days. Johnson has said that Britain will depart from the European Union on October 31 even if no transitional deal has been hammered. This has jittered investors who fear a no-deal Brexit will push down the British economy. He has also said that the previous deal proposals from former PM Theresa May will not be renegotiated.


COMMENTS