

Here are the latest market charts and analysis for today. Check them out and know what’s happening in the market today.

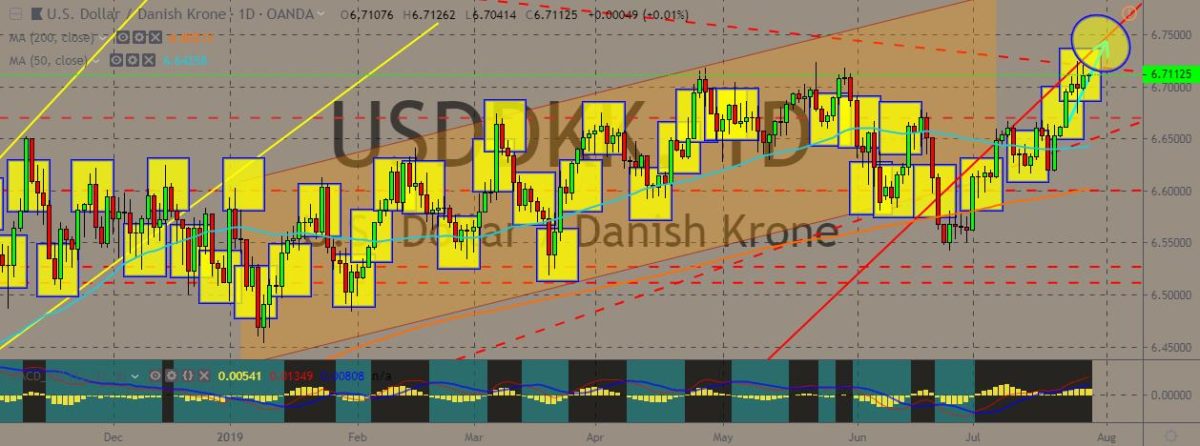
USDDKK
The pair continued to trade higher on the daily charts, showing the dollar’s continued strength. The pair is now trading above the 50-day and 200-day moving averages, indicating further bullish trend in the future. US gross domestic product (GDP) grew at a 2.1% annualized rate during the second quarter, according to the data released last week by the Department of Commerce. The growth was driven primarily by consumer and government spending, although the gains were capped by negative contributions from investments. The GDP report came just in time as the International Monetary Fund released an update to its World Economic Outlook, which forecasted the US economy to grow 2.6% for 2019. The greenback latched on to its gains after the data, which was considered to be better than expected. The markets still expect the US Federal Reserve to cut interest rates for the first time in more than a decade.
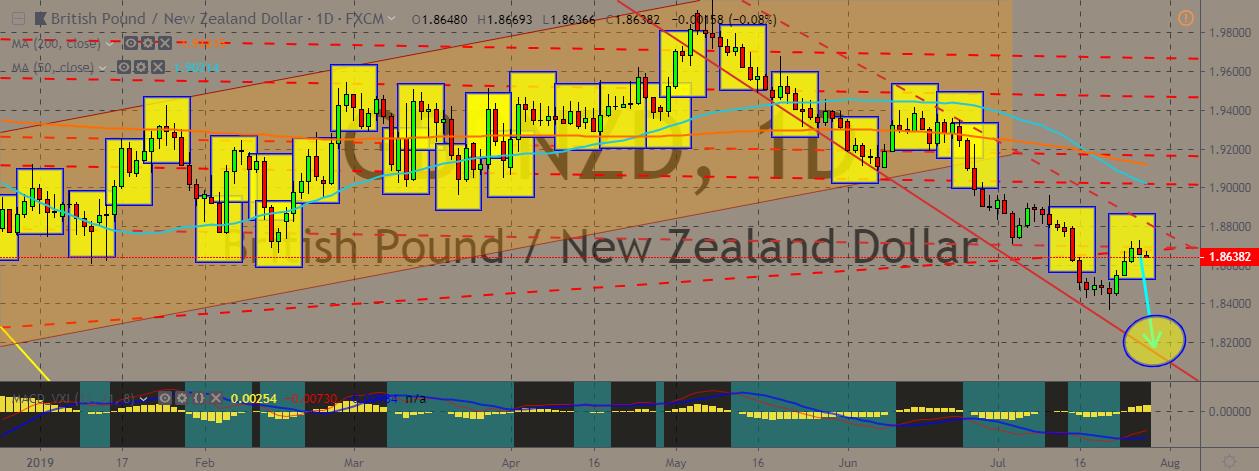
GBPNZD
The pair recently gained back some of its losses during the previous month, although it still traded within the range of a trend that’s generally going downwards. The trend is expected to continue over the coming week, backed by the fact that it is trading below the 50- and 200-day moving averages on the daily chart. On the British side, it has been reported that the new government was working on the assumption of a no-deal Brexit with the European Union, which is expected not to renegotiate its agreement with the United Kingdom over the country’s departure from the trading bloc. New UK Prime Minister Boris Johnson has said he planned a new exit deal with the EU, while the bloc has repeatedly rejected such notions. Meanwhile, a think tank concluded that Johnson’s ambitious domestic agenda would be pummeled by the potentially catastrophic no-deal Brexit.
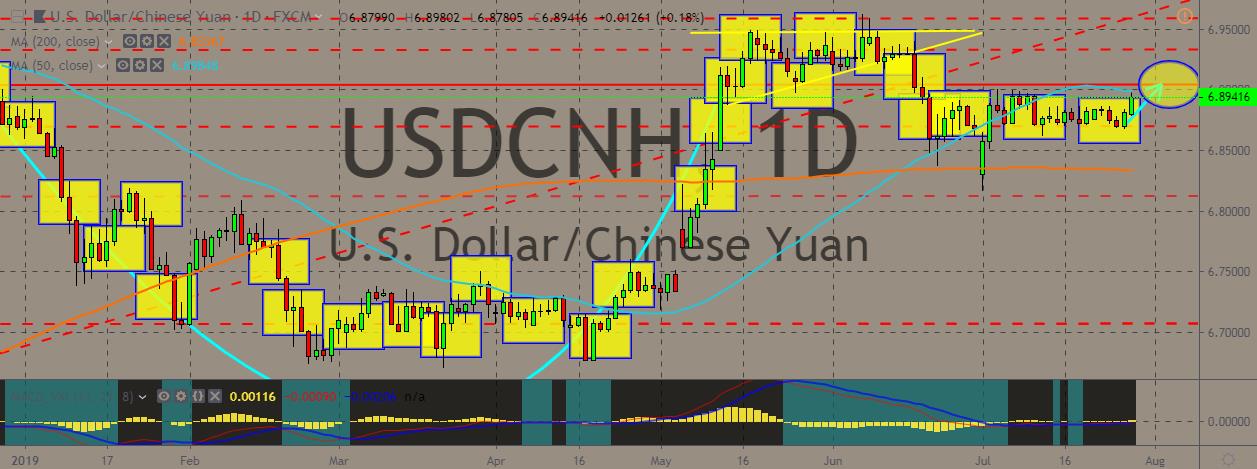
USDCNH
The pair edged higher, with the US dollar strengthening and the Chinese yuan weakening. The pair is trading just below the 50-day MA on the daily chart, with that indicator poised for a downward move, while the 200-day MA remains barely changed below. In China’s spot foreign exchange market, the yuan is allowed to rise or fall by 2% from the central parity rate each trading day. Such central parity rate of the yuan against the greenback is derived from a weighted average of prices offered by market makers before the opening of the interbank market each business day. The widely expected interest rate cut by the United States’ central bank is seen to give China some more wiggle room in shoring up its slowing economy, according to some analysts. Looser monetary policy would reduce the pressure on China’s central bank to ease monetary policy. The Asian country’s economy has struggled to gain momentum in recent years.
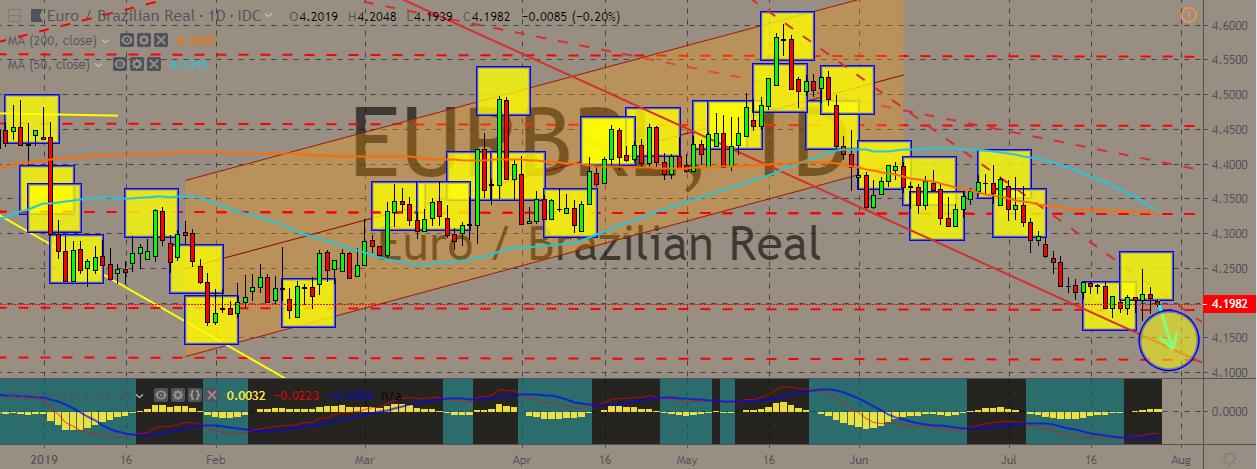
EURBRL
The pair traded below both the 50-day and 200-day MA, which is on the verge of confirming the death cross, in which the 50-day MA would cross below the 200-day MA on the daily chart. This generally indicates a bearish trend for the longer term. The pair currently sits on top of solid support line near multi-months low for the pair. On the fundamentals, 40% of the Eurozone countries are running growing budget surpluses, or roughly balanced public sector accounts, with their public debt at or lower than the union’s mandated 60% of gross domestic product. On the Brazilian front, the International Monetary Fund is calling for Brazilian authorities to approve a draft law that is intended to reinforce the independence of the Central Bank of Brazil. According to the latest Article IV consultation, the fund’s staff praises a recent bill that limited transfers derived from reserve evaluations from the central bank to the Treasury.


COMMENTS