

Here are the latest market charts and analysis for today. Check them out and know what’s happening in the market today.

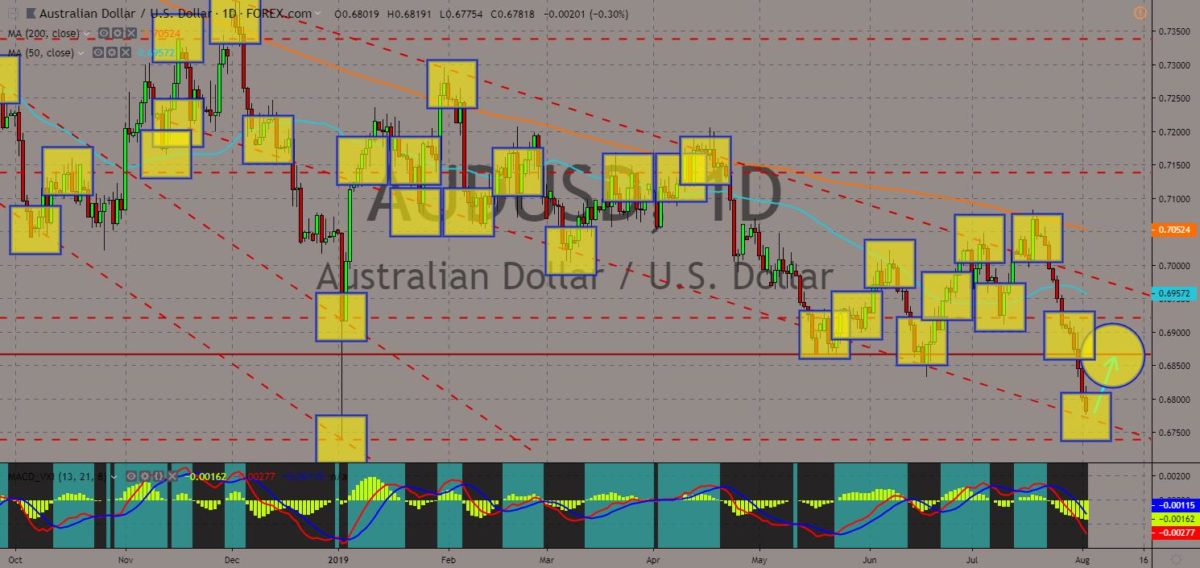
AUDUSD
The pair was expected to bounce back from a downtrend support line, sending the pair higher towards a major resistance line. Australia had been pushing for a trilateral alliance between the country, the United States, and Japan, as growing military threats from China pushed former enemies, Australia and Japan, to cooperate with each other. Aside from this, the U.S. said it was preparing $250 million to build military bases in Australia. Aside from this, the U.S. imposed 10% tariffs on $300 billion worth of Chinese goods amid the trade truce signed between U.S. President Donald Trump and Chinese President Xi Jinping during the 2019 G20 Leaders Summit in Japan. Australia also want China to help rewrite the global trade rules from claiming that China is no longer a “developing country” to dropping its title as the second largest economy in the world. Histogram and EMAs 13 and 21 will continue to go down.
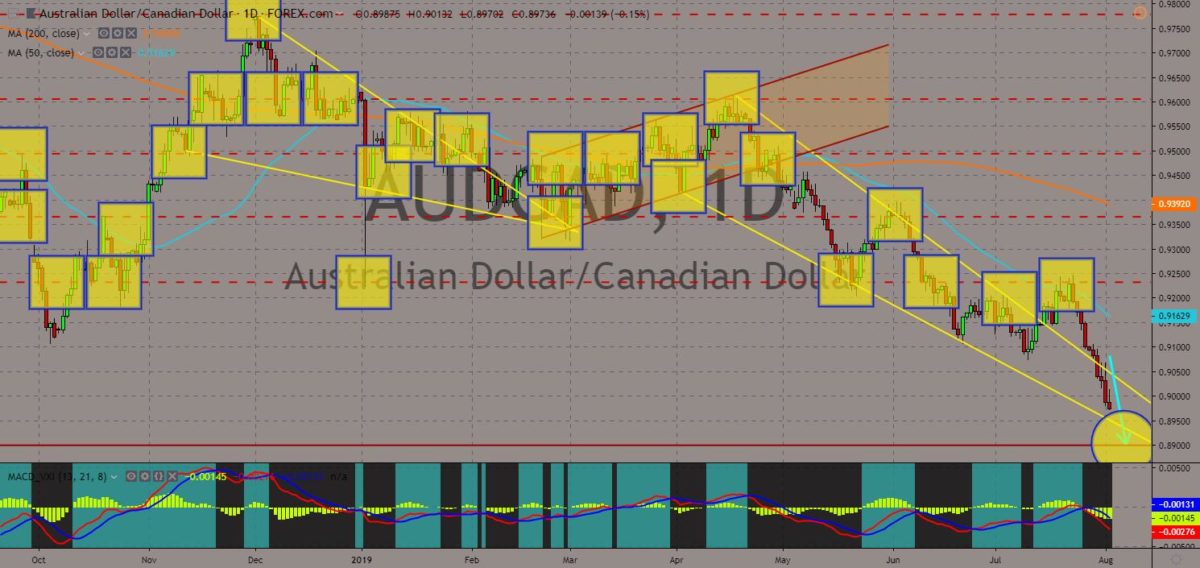
AUDCAD
The pair will continue its steep decline after it failed to sustain its strength following its breakout from a downtrend channel resistance line. The delay for approving the legality of a trade agreement between the European Union and Canada had been benefiting Canada. Following the aftermath of the 2016 British referendum, former commonwealth countries held talks with the United Kingdom to plan an eventual free trade agreement (FTA) between the parties involved. These efforts are also motivated with the proposed integration of the CANZUK (Canada-Australia-New Zealand-United Kingdom), which are former British colonies, once the UK eventually leave the EU. After receiving a green light from the EU Parliament, Canada had delayed talks with the EU to pursue a more appealing temporary tariff rates from the United Kingdom. Histogram and EMAs 13 and 21 was poised to further go lower.
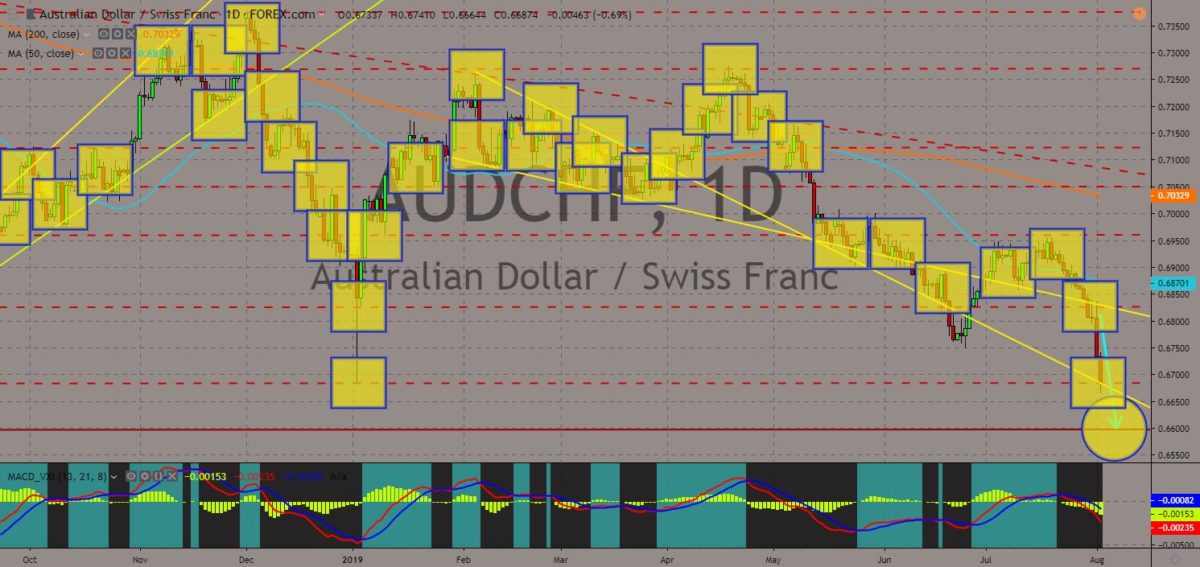
AUDCHF
The pair was expected to further move lower and break down from a support line. Australia lagged behind countries who signed the post-Brexit trade agreement with the United Kingdom. The country had stick with its plan to be the first country to eventually sign a free trade agreement (FTA) with the UK, ignoring some potential agreements where it can also benefit. Australia was losing against Japan in dominating the pacific rim trade pact, the CPTPP (Comprehensive and Progressive Trans-Pacific Partnership). Aside from this, Switzerland, who is also a signatory of the post-Brexit trade agreement, had inked partnership with China to become the first European country to sign a trade agreement relating to China’s Belt and Road Initiative. Australia was also left behind after New Zealand Prime Minister Jacinda Ardern visited China. Histogram and EMAs 13 and 21 will continue to move lower.
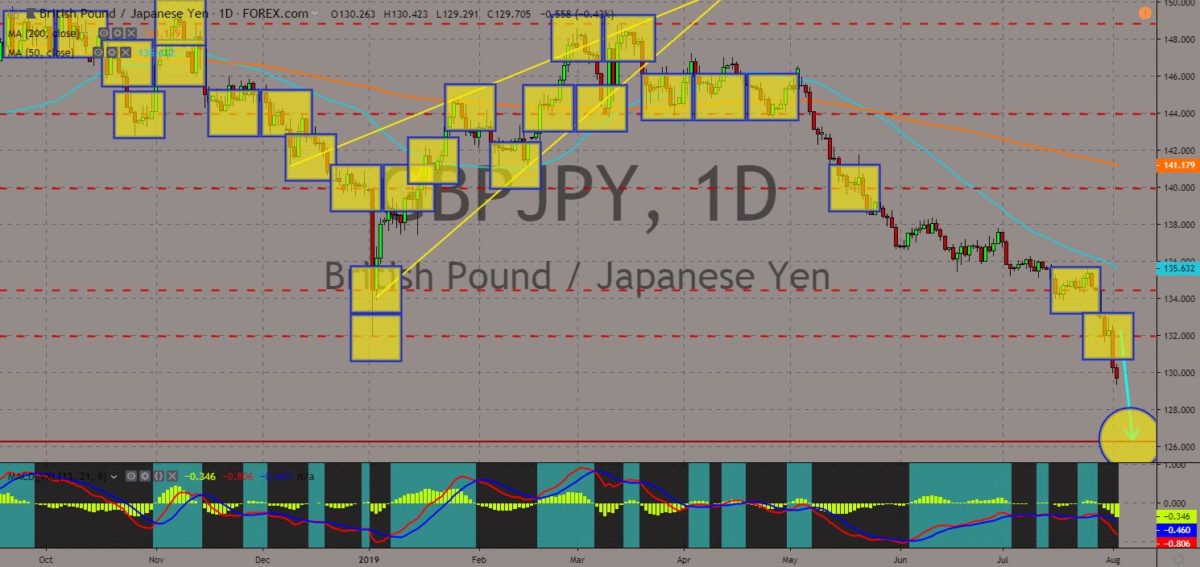
GBPJPY
The pair broke down from a major support line, sending the pair lower towards another major support line. The United Kingdom was set to withdraw from the European Union until October 31 with UK Prime Minister Boris Johnson saying that the UK will leave the bloc with or without deal. UK’s withdrawal was seen by analysts as a way for the country to bring back its former glory and to get rid of EU Institutions, which the country accused of developing a backdoor federalism and taking power from countries. Japan on the other hand was also a former world power before its defeat against the United States. With the changing geopolitics, however, Japan was seen strengthening its economy and military amid the on-going tension among the United States, China, and Russia. The United Kingdom’s future on the other hand, was still uncertain. Histogram and EMAs 13 and 21 was seen to continue to move lower.


COMMENTS