

Here are the latest market charts and analysis for today. Check them out and know what’s happening in the market today.
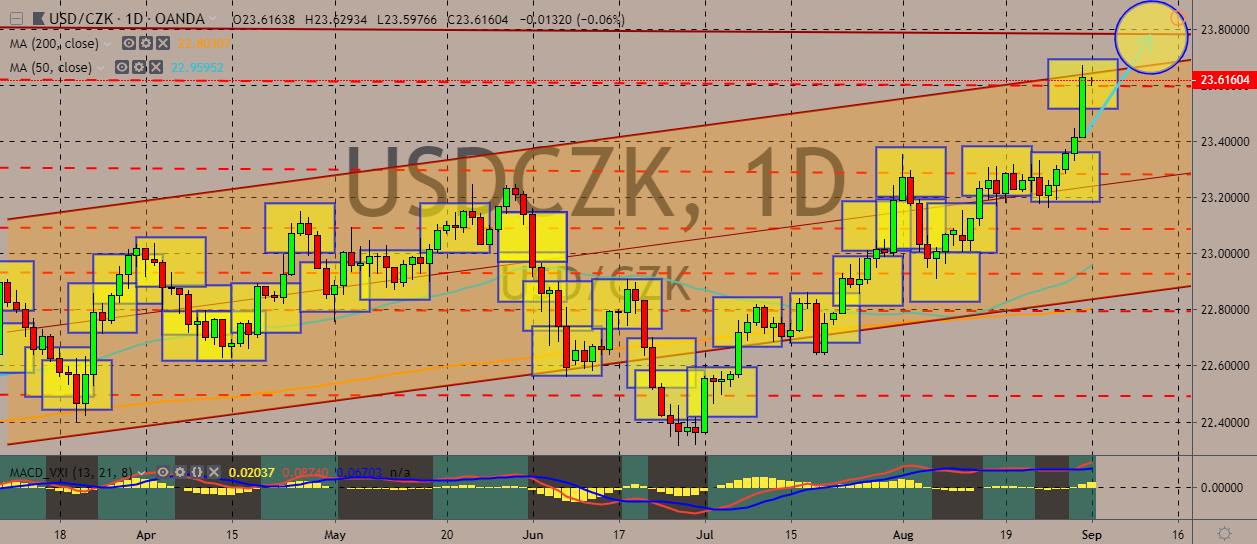
USDCZK
The pair is trading up the daily charts with bullish sentiment all over the dollar, as the 50-day moving average continues to aim for a higher movement. The pair is trying to break above the trading channel after rebounding from a recent sideways trade. Over in Czech Republic, the Czech Central Bank (CNB) kept its countercyclical capital buffer (CCB) for banks’ capital reserves at 2.00% last week. In May, the bank implemented an increase. After that, it stated that another increase has been less probable. The CNB is one of the European banks that have imposed rates to protect the banking sector against the risks from the overall financial cycle, particularly when credit growth strengthens. On September 6, the bank is scheduled to comment on its growth. Meanwhile, the dollar saw a bit of weakening after consumer sentiment declined to its lowest level since October 2016, with the US-China trade row hitting domestic spending.
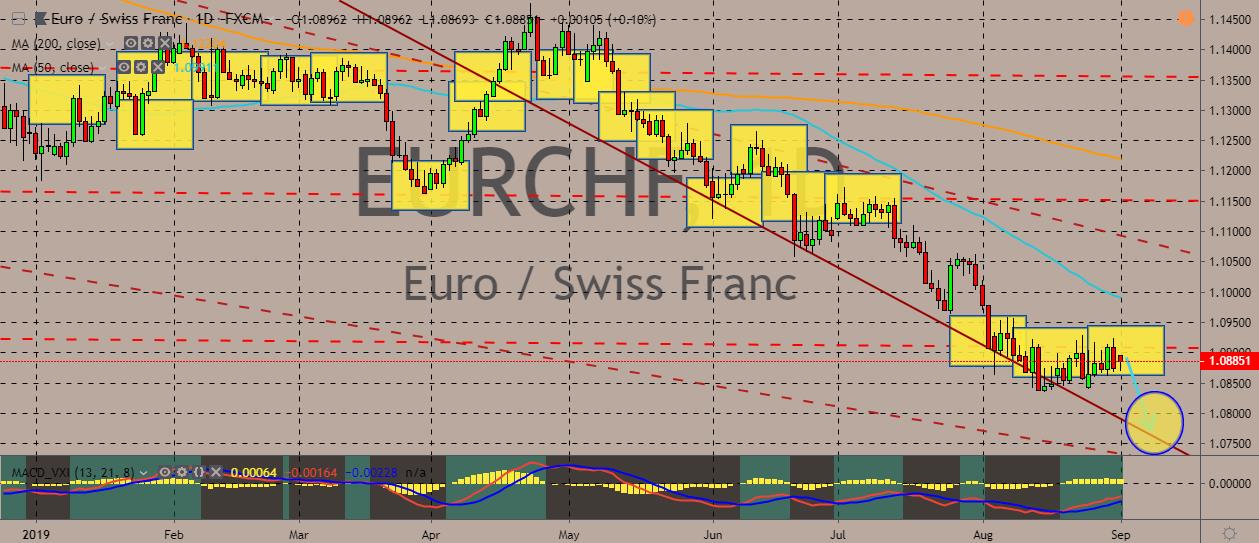
EURCHF
The pair is weakening further as the euro gives in to the safe-haven appeal of the Swiss franc. The price is now trading at multi-months low, with the 50-day moving average and the 200-day counterpart further diverge from each other. In economic and political news, Swiss economy minister said that Switzerland is not likely to hammer out a deal with the European Union this year over a delayed partnership treaty. This prolongs an impasse that has damaged bilateral ties and disrupted cross-border trading. European Commissioner Jean-Claude Juncker called for the wrapping up of the accords before his term expires on October 31. The Swiss government also said that it would prefer to have sealed a deal by said date. Brussels blocked EU-based investors from trading on Swiss exchanges from July 1 as the conflict worsened over the treaty, which enables non-member Switzerland to routinely adopt the EU single market rules.
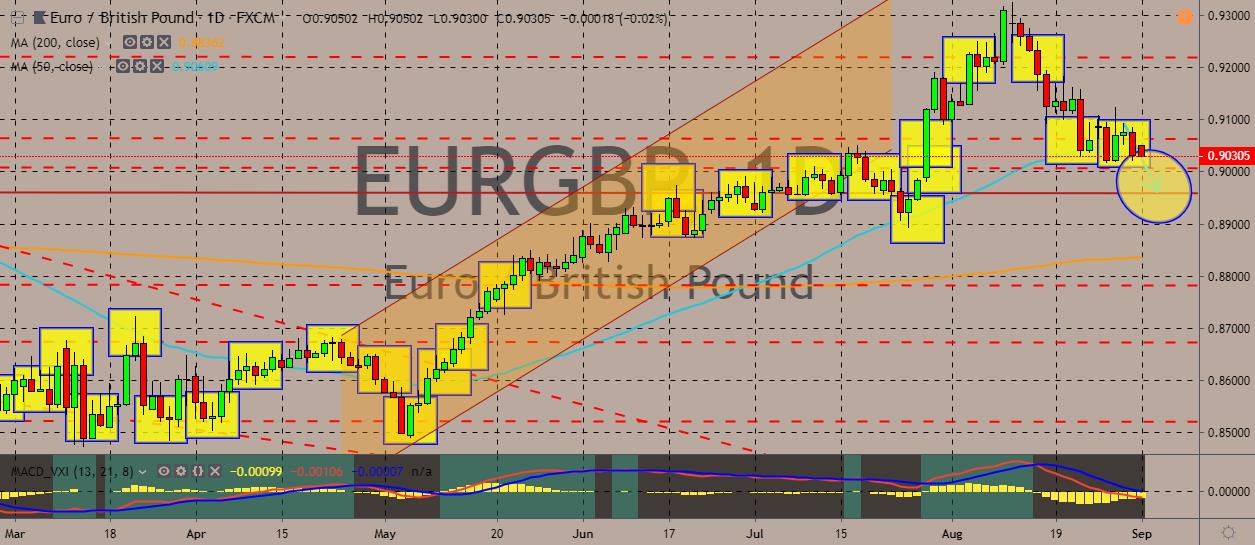
EURGBP
The pair is trading near a number of support and resistance lines, with the closest at 0.9065 as the pair converged with the 50-day moving average price level. The pair is treading downwards, with the Euro weakening against the British pound. Fears of a no-deal Brexit have become more pronounced, with UK Prime Minister Boris Johnson acquiring permission to prorogue the UK parliament for 5 weeks, which is unusually long. The prorogation is widely considered to be a move to prevent the Parliament from blocking a no-deal Brexit. Meanwhile, the eurozone economic outlook remains weak. German data continues to signal that the bloc’s biggest economy is floundering, unable to recover from a huge slowdown, resulting to persisting German recession fears. Markets are also seeing higher chances of interest rate cuts. Analysts are expecting the latest euro zone inflation data to strengthen the ECB’s case for policy easing.
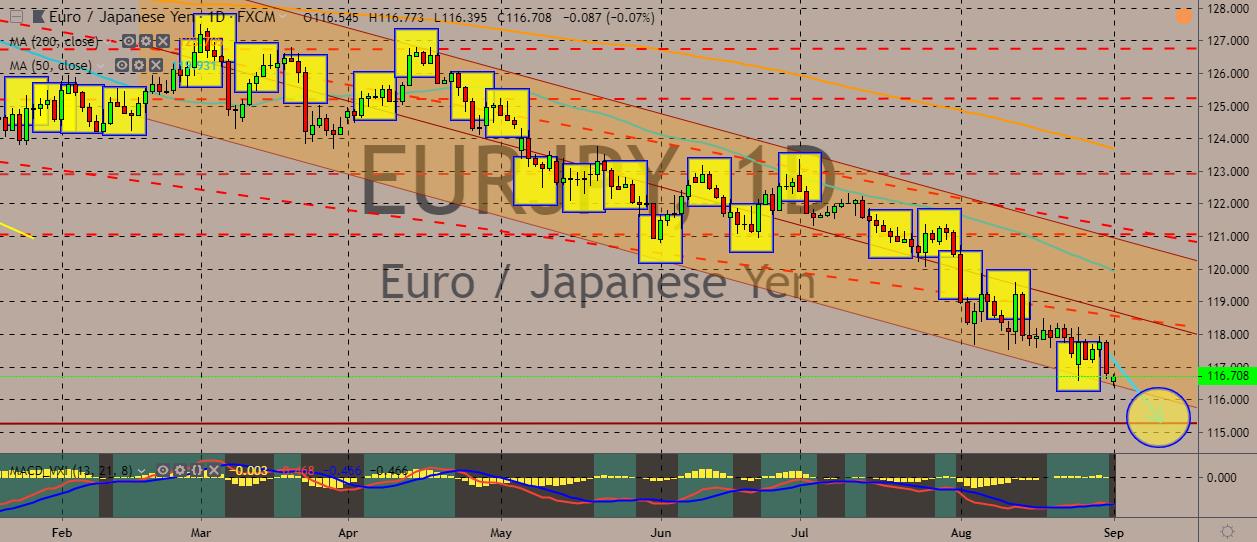
EURJPY
The pair is trading near 2017 lows, with the oversold signals popping up and indicating that the pair will likely rebound from a falling trend line. The euro has been pressured by the recent data that showed eurozone inflation remained at a low 1.0% in August. This further strengthens the case for the ECB’s controversial economic stimulus. The data fell in line with analyst forecasts and far from the ECB’s target inflation just below 2.0%. The data came in as the world is concerned over the global economy, which is suffering from the protracted US-China trade war that has pummeled the economy of Germany, the eurozone’s economic powerhouse. The ECB will probably analyze core inflation that strips out volatile prices such as energy. The core inflation also was unchanged at 0.9% in August. Meanwhile, eurozone unemployment rate was still stable at 7.5% in July, its lowest level since July 2008.


COMMENTS