

Here are the latest market charts and analysis for today. Check them out and know what’s happening in the market today.
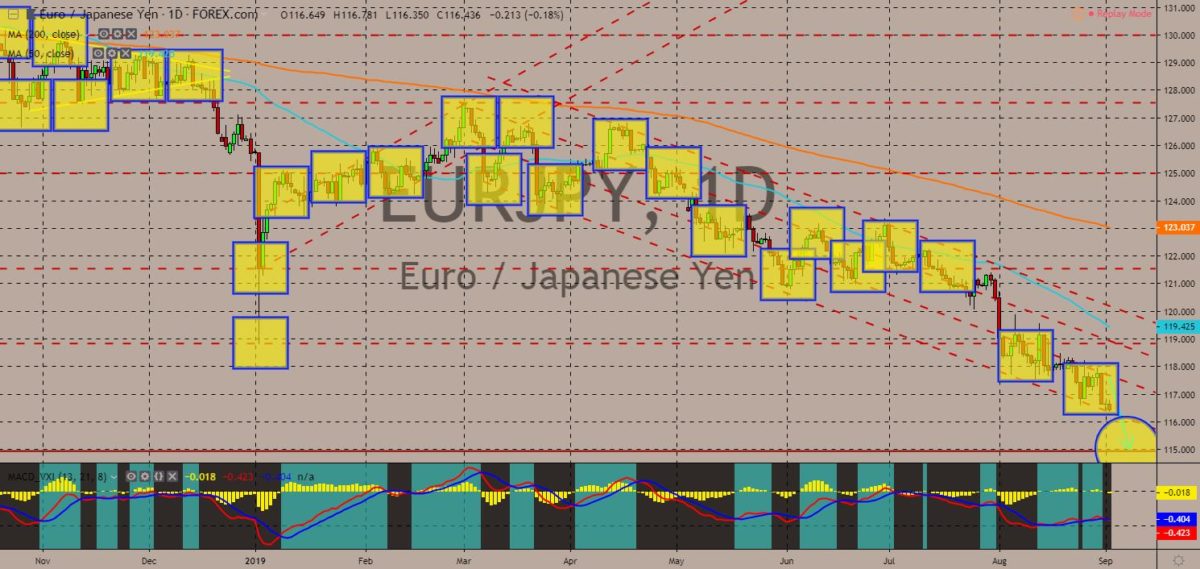
EURJPY
The pair is seen to breakout from a major support line, which will send the pair lower toward its 38-month low. Japanese Prime Minister hosted the 2019 G20 Leaders Summit in Osaka. During the summit, several issues were discussed. PM Abe discussed the nuclear missile test in North Korea with U.S. President Donald Trump, while he asked the first-time attendee and new British Prime Minister Boris Johnson regarding his plans for the future of the United Kingdom. Johnson reassured a smooth withdrawal of the country from the European Union. After Trump withdraw from the rest of the world, the EU said it assumed global leadership. However, as months passed by, it seems like Japan will be the one to replace the U.S. from its global role, stripping EU leadership of its relevance in the global arena. Histogram and EMAs 13 and 21 is seen to continue to move lower in the following days.
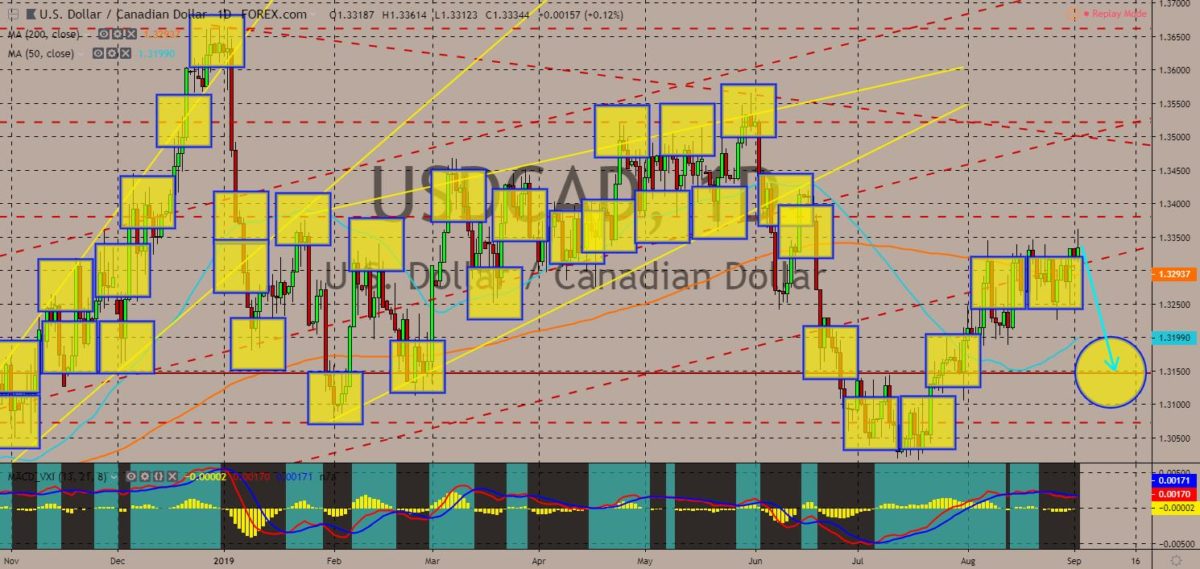
USDCAD
The pair failed to breakout from key resistance line, sending the pair lower towards a major support line. President Donald Trump is under pressure from U.S. agricultural sector. This was amid the escalating U.S.-China trade war, while the NAFTA (North Atlantic Treaty Organization) isn’t officially ratified yet. U.S. Farmers suffer from the additional tariffs imposed by China to the U.S. Aside from this, amid the expectation by the market of higher agricultural prices, demand for U.S. agriculture became weaker. This will be challenging for U.S. President Donald who is seeking to be reelected for another term. On November 2020, the U.S. will hold its presidential election and Democrats are waiting to elect their candidate. Democrats win the majority of the House of Representative this year and prevented Republicans from passing Trump’s policies. Histogram and EMAs 13 and 21 will reverse back.
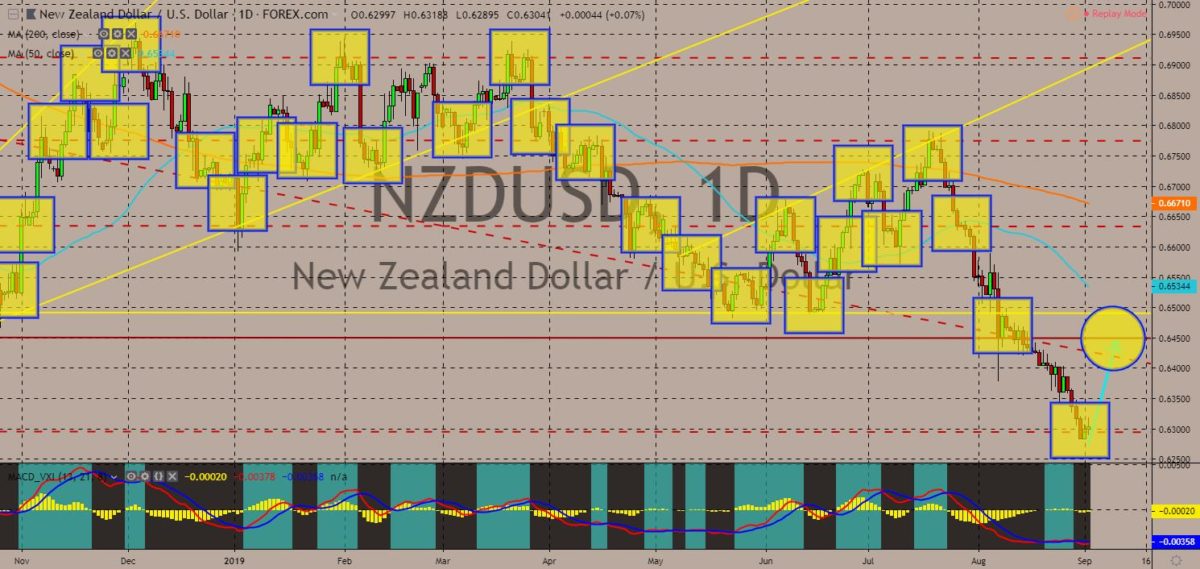
NZDUSD
The pair is expected to bounce back from its 38-month low and test to breakout from its current resistance line. In September 01, the 15% tariffs imposed by U.S. President Trump to China took effect, which further escalates the trade war between the two (2) largest economies in the world. This tit-for-tat trade war between the United States and China is expected to affect emerging economies, particularly those that are dependent on U.S. and China’s imports or export. These economies, however, had already found a way to dodge and minimize the effect of trade war. Australia and New Zealand is currently negotiating new terms with their free trade agreement (FTA) with the European Union and has been preparing for a post-Brexit trade agreement with the United Kingdom. The shift in economic alliances is expected to prevent global recession. Histogram and EMAs 13 and 21 were poised to go up.
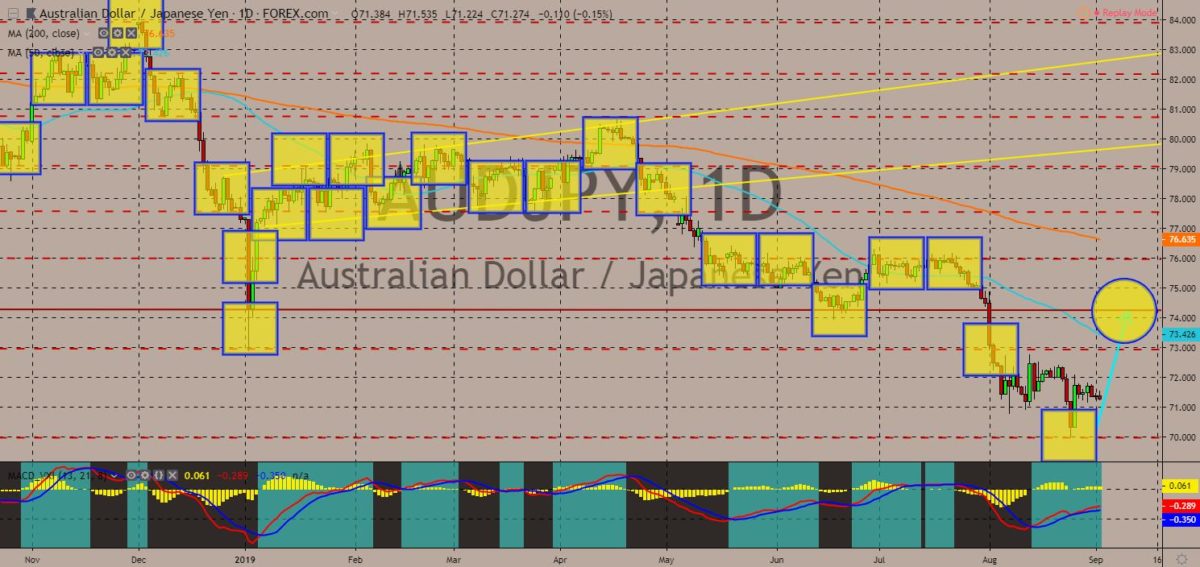
AUDJPY
The pair found a strong support line, which will send the pair higher to retest a major resistance line. Australia and Japan were in a military cooperation together with western powers like the United States. This was to secure the region amid rising tensions between China and claimant countries in the South China Sea. Despite this, the two (2) economies were still at odds when it comes to trade. They both headed the pacific rim trade pact, the CPTPP (Comprehensive and Progressive Trans-Pacific Partnership). Australia recently announced that it will not renegotiate the current terms in the CPTPP with Japan’s beef export. This was amid Japan increasing its beef exports to other CPTPP members like Canada. Japan is also facing tariff from U.S. President Donald Trump together with the European Union. This will likely to disturb the current order of exports and imports. Histogram and EMAs 13 and 21 will continue to go up.


COMMENTS