

Here are the latest market charts and analysis for today. Check them out and know what’s happening in the market today.
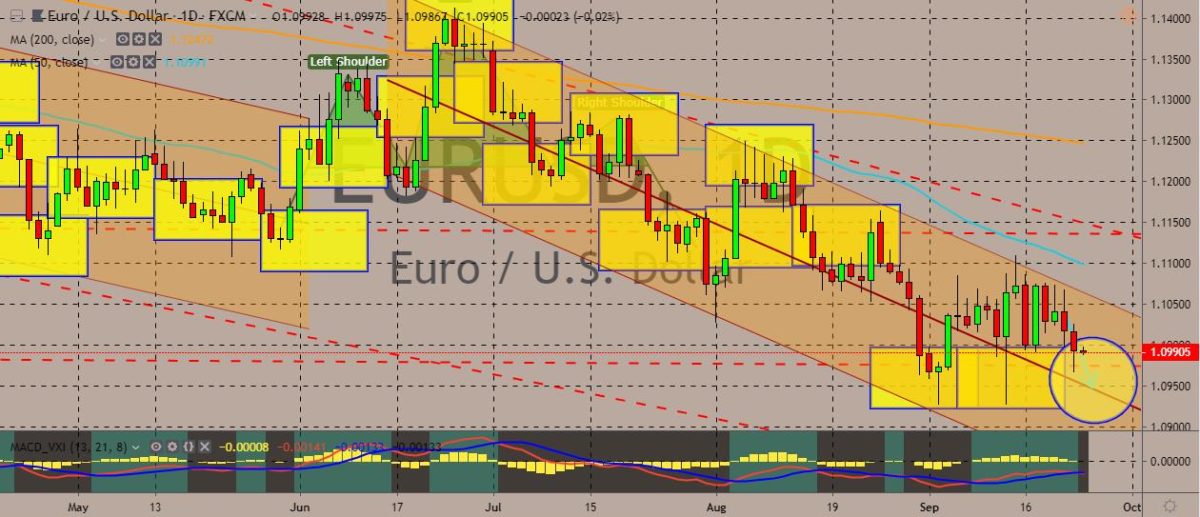
EURUSD
The pair started the trading week on a negative note, falling to record lows and closing in the red. The pair still trades below the 50-day moving average, which is also below the 200-day moving average. This indicates a bearish sentiment for the traders at least for the short term. The reason for the weakness in the recent German Manufacturing PMI data, which showed disappointing results. The figures fell to 41.4, which was worse than the previous month’s number of 43.5. This is also the lowest level in a decade. At the same time, this solidifies the common notion among experts and economists: the eurozone economy is faltering. Adding to the bearish attitude towards the euro is the European Central Bank’s stimulus package, which was reignited after accounting for the worsening economic uncertainty surrounding the eurozone. Draghi has said that the Governing Council should consider ideas like the Modern Monetary Theory.
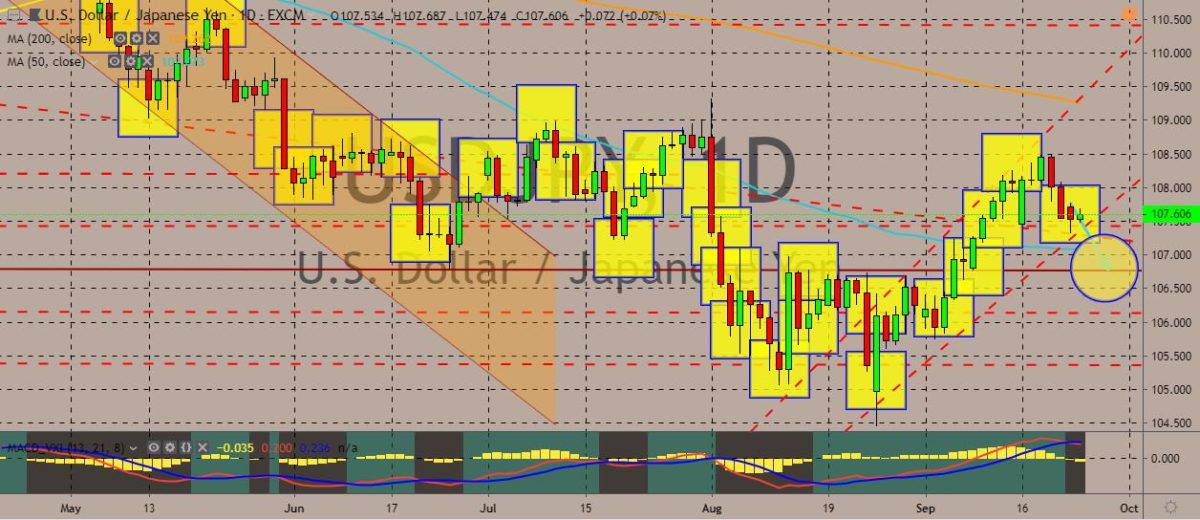
USDJPY
The pair is trading on a bullish note after giving up its gains during the last sessions. The price still lies above the 50-day moving average but still below the 200-day moving average. This indicates tight trading ranges to expect in the short-term. Over in Japan, the Bank of Japan decided not to change its policy. It, however, added that it would review the recent economic and financial developments more deeply at the next meeting that they will hold on October 30 to 31. The yen, on the other hand, isn’t expected to weaken very much as the markets have mounting expectations that the central bank has little wiggle room to offer more stimulus and any additional measure would probably be ineffective. Still, any further easing from the BOJ will be reactive to easing from the European Central Bank in Europe and the Federal Reserve from the United States.
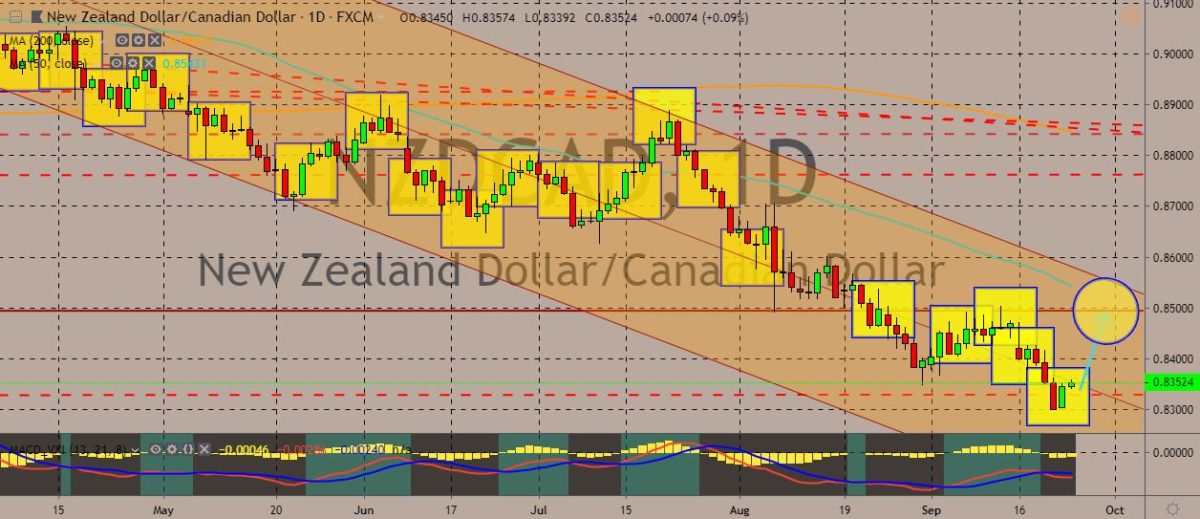
NZDCAD
The pair still stays within the downtrend trading channel, with the price still hovering above and below the middle band. Price still trades below the 50-day moving average, which also lies way below the 200-day moving average. This marks overall bearish sentiment on the pair, with traders treading carefully between the two currencies. The New Zealand dollar is strengthening ahead of the Reserve Bank of New Zealand’s rate decision. This indicates that NZD traders are somehow betting on the chance that the RBNZ may be more hawkish than expected. The kiwi central bank is expected to leave rates unchanged, but it may also signal more easing in the future. Over in Canada, the release of domestic wholesale trade data backed bets that the Bank of Canada would decide not to move its key interest rate this year. The Bank of Canada has kept its benchmark rate on hold at 1.75% in 2019 even though major peers have cut theirs.
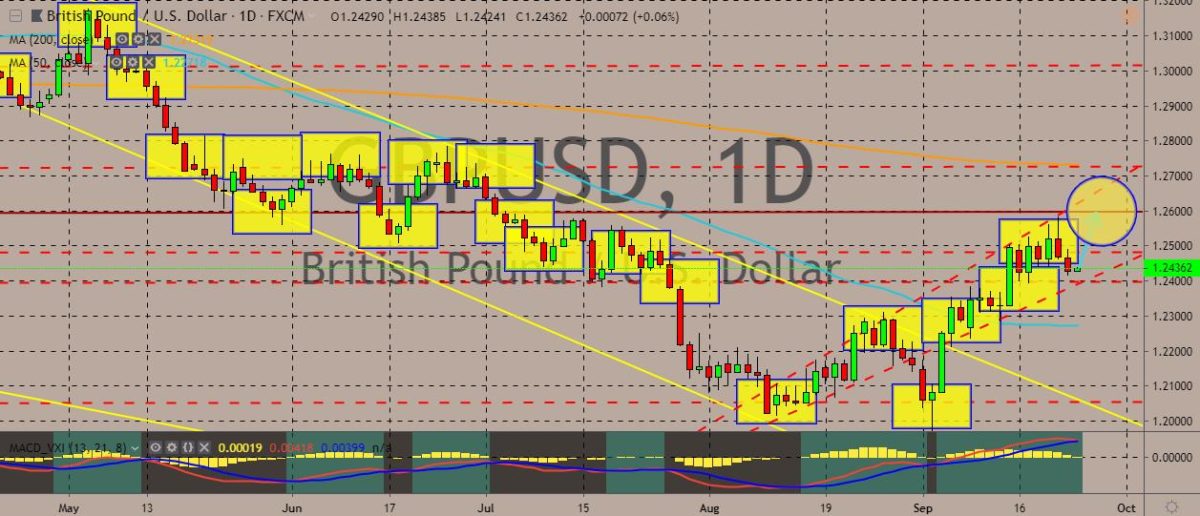
GBPUSD
The pair has fallen in recent trading sessions, although it now trades in the negative again. It’s also stuck between the 50-day moving average and the 200-day counterpart, with a bias for the bears. Recently, the Bank of England kept all its policy-setting unchanged. The MPC says that it could expect interest rate increases “at a gradual pace and to a limited extent.” Over in the United States, the numbers seemingly indicate that the economy stabilized after brawling with trade-related uncertainties toward the end of summer. However, data also suggest that the economy isn’t growing as rapidly as it had last year. A survey showed a slight uptick in growth both in the manufacturing and service sectors of the economy, according to IHS Markit. The IHS flash services index rose to 50.9 from 50.7, while the flash manufacturing index gained to a five-month high of 51 in September from 50.3 in the previous month.


COMMENTS