

Here are the latest market charts and analysis for today. Check them out and know what’s happening in the market today.
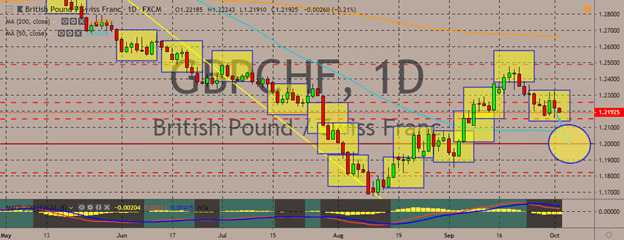
GBPCHF
The pair is trading weakly after reaching weekly highs in the previous sessions. At the same time, intraday record lows have been reached. The price is traded above the 50-day moving average but below the 200-day counterpart. This indicates a generally bearish bias for the pair. The British pound kicked off the new month with a bullish bias against other major currencies. Markets are virtually preparing for the United Kingdom’s submission of a revamped proposal that aims to solve the question of the Northern Irish border. According to various news sources, British Prime Minister Boris Johnson will call European officials and relay the details of the Kingdom’s latest proposal before the submission of the official document. Johnson is also expected to deliver a speech later in the day to the Conservative conference. Markets will be following the response of various European players to seek clues if the UK has submitted something viable.
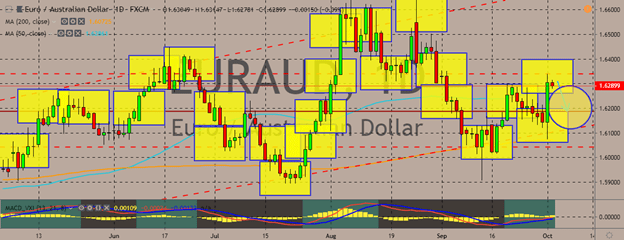
EURAUD
The pair has risen to monthly highs in the recent sessions, paring all previous losses and breaking above the 50-day moving average, although it’s as of now trading slightly in the red. The latest soaring of the pair’s price came after the Reserve Bank of Australia’s decision to cut rates by 25 basis points to 0.75%. Economists largely expected the cuts, but the markets only gave the decision an 80% probability. For the short-term, the sentiment for the pair is biased on the upside. Over in the eurozone, the case for the stimulus package just got stronger as data showed that inflation in the region weakened in September. Eurostat said that the annual inflation rate eased to 0.9% in September, down from 1.0% in August. Low inflation is generally a sign of weakness and has been the source of contention for the European Central Bank’s officials, who are trying to put inflation just under 2%. On September 12, the central bank decided to unleased measures to boost inflation.
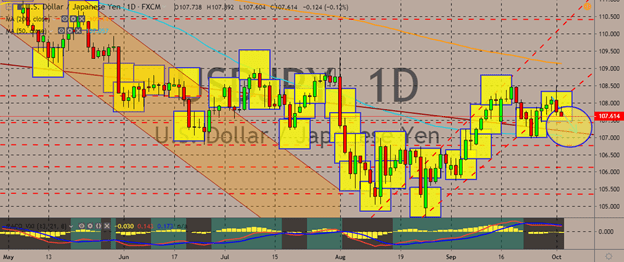
USDJPY
The pair is trading under pressure as traders try to gauge just how much risks they can take while trading the dollar, although both of the currencies have safe-haven appeals. The Japanese yen soared after a gauge of US manufacturing showed the lowest reading in more than a decade in September. Exports plummeted amid the escalated trade war between the US and China. The US manufacturing purchasing managers’ index came in at 47.8% in September, which is the lowest since June 2009. This also marks the second consecutive month of contraction, as the figure is below 50. The new export orders index was only 41%, which is the lowest since March 2018. This was lower than the August reading of 43.3%. The data and its implications fueled fears of a recession and hit other financial markets. The deeper contraction in the manufacturing sector is the latest sign that the trade war has been taking its toll in the economy.
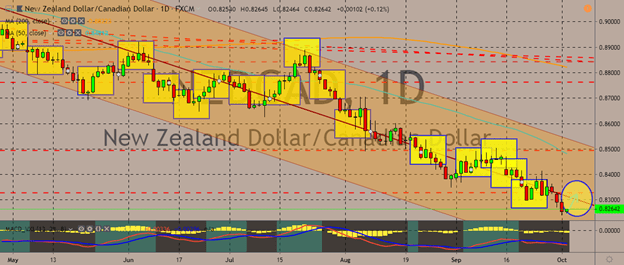
NZDCAD
The pair is keeping faithful to its trading channel, trading with a downward bias within the lower portion of the trading channel. Over in New Zealand, economic data showed that business confidence in the country was declining rapidly on the back of a global slowdown. That is in spite of the central bank’s efforts to boost growth. The NZD has weakened against many major currencies. Survey by ANZ bank showed that the business confidence fell to its lowest since April 2008. The same can be said of the Canadian economy, which was suddenly unmoved in July after four months of growth. The country’s mining, quarrying, and oil and gas extraction sectors all contracted, according to Statistics Canada. Analysts have expected a 0.1% increase in July, after a 0.2% increase in June. The Canadian dollar took the brunt of the weak data, similarly weakening as the New Zealand dollar.


COMMENTS