

Here are the latest market charts and analysis for today. Check them out and know what’s happening in the market today.
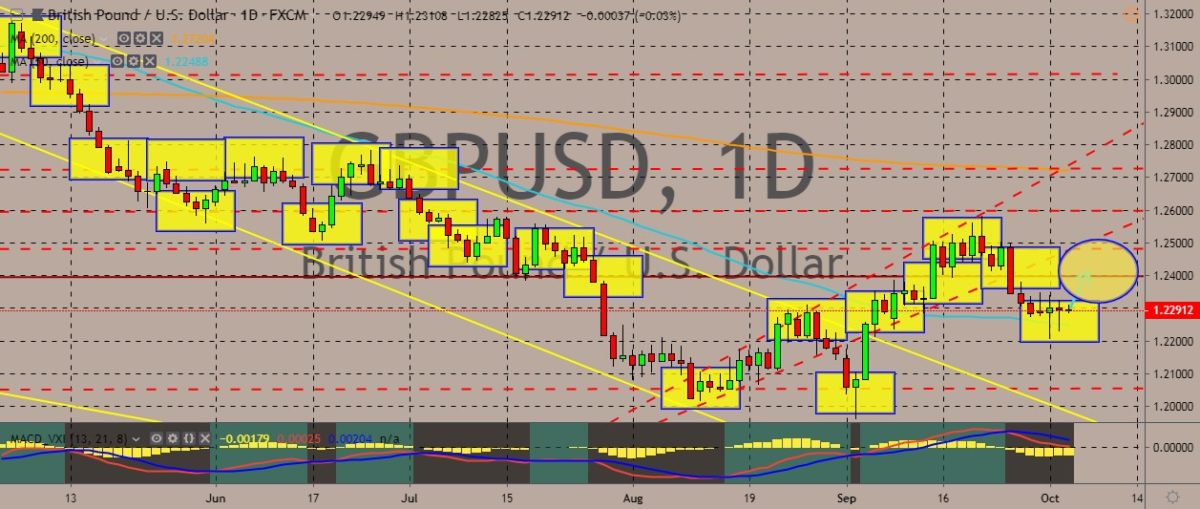
GBPUSD
The pair has recently plummeted and managed a breakout from the recent uptrend, with the price reaching weekly lows during sessions. The price has converged with the 50-day moving average, but used it as a solid support line. Brexit uncertainty still looms large on the market. British Prime Minister Boris Johnson still feels adamant in pulling out the United Kingdom from the European Union on October 31—with or without an agreement. Apart from the Brexit woes, eyes are also on the UK Manufacturing PMI, which rose 48.3 from 47.4. This was better than the markets’ expectations, although it virtually doesn’t really change anything. Over in the US, the ISM Manufacturing PMI slipped to 47.8 in September from the 49.1 figure in August. This indicates a contraction the sector, with the figure failing to meet analysts’ expectations of a rise to 50.1. The latest figure is the index’s lowest level since it hit 46.3 in June 2009.
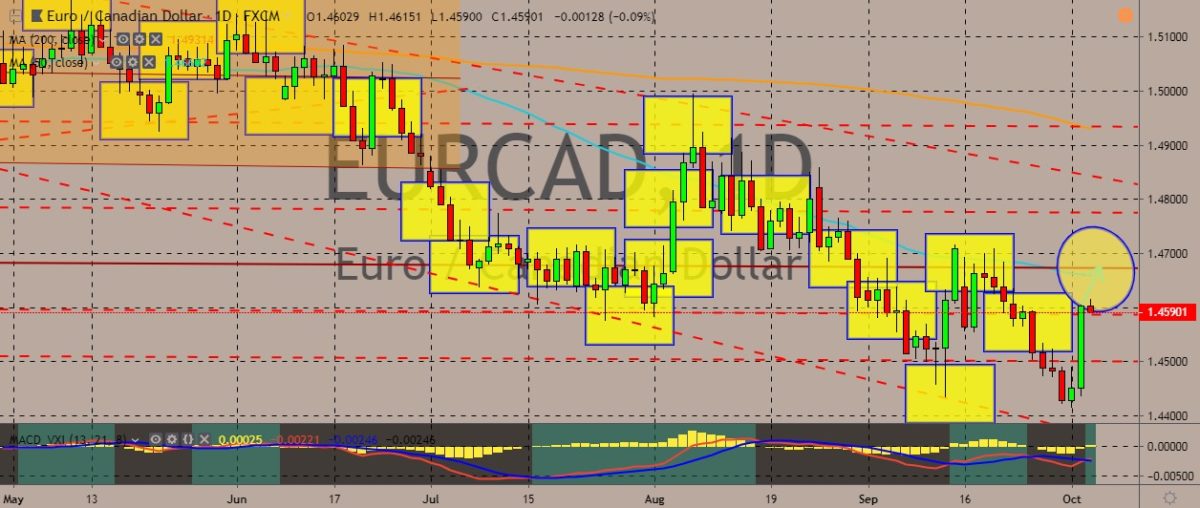
EURCAD
The pair is currently trading in the red after a steep rise in the previous session. It’s now hovering below the 50-day moving average, although a further rise in the price could still be difficult to pull off for traders. Over in the eurozone, inflation has fallen further below the European Central Bank’s target. According to the latest estimates, inflation has dropped to its lowest monthly rate for nearly three years of 0.9% in September. This makes the ECB’s case for monetary stimulus in the economy stronger. Meanwhile, the Canadian dollar weakened after data showed that economic growth was virtually flat in July, coming after a strong second quarter. This could dethrone the loonie from its position as the best-performing major currency of the year. The country’s economy grew 0% in July, according to Statistics Canada. This fails to meet the markets’ expectations of a 0.1% growth.
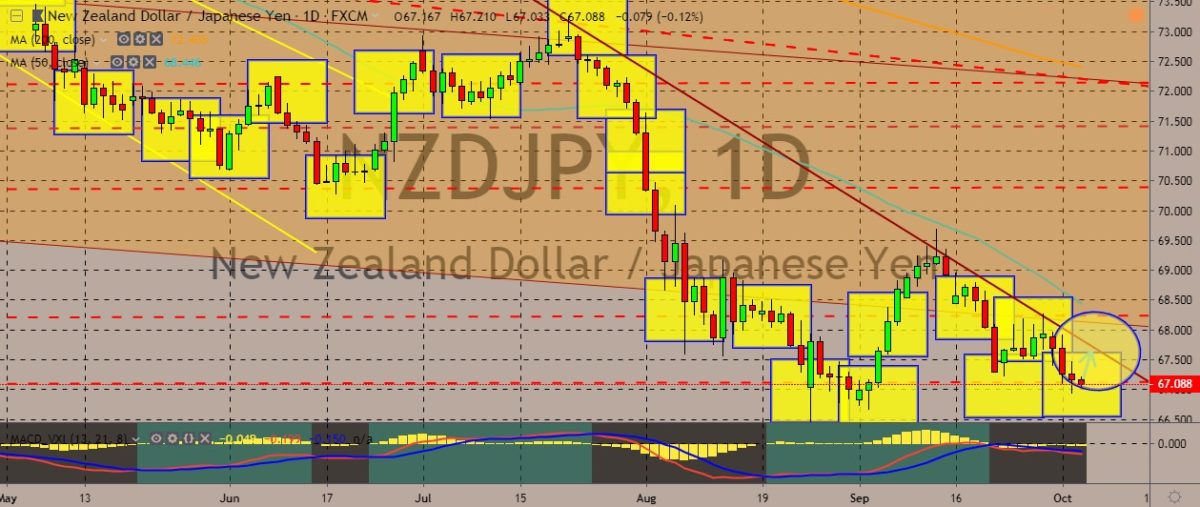
NZDJPY
The pair has officially entered a downtrend, and prices are continuing to weaken as the New Zealand dollar continues to lose steam while the Japanese yen continues to gain strength with risk aversion mounting up. Over in New Zealand, the central bank is calling for new powers that would enable it to take a more active role in overseeing the cash system. The new powers could also enable the bank to implement further regulations to protect access to cash. Over in Japan, the government has decided to increase its national sales tax for the first time in more than five years. This decision is putting the world’s third largest economy to a test of economic strength. The said tax increase has been postponed twice, but now it’s being raised to 10% from 8%. According to Japanese Prime Minister Shinzo Abe, the government needed more money to support the fast-aging population.
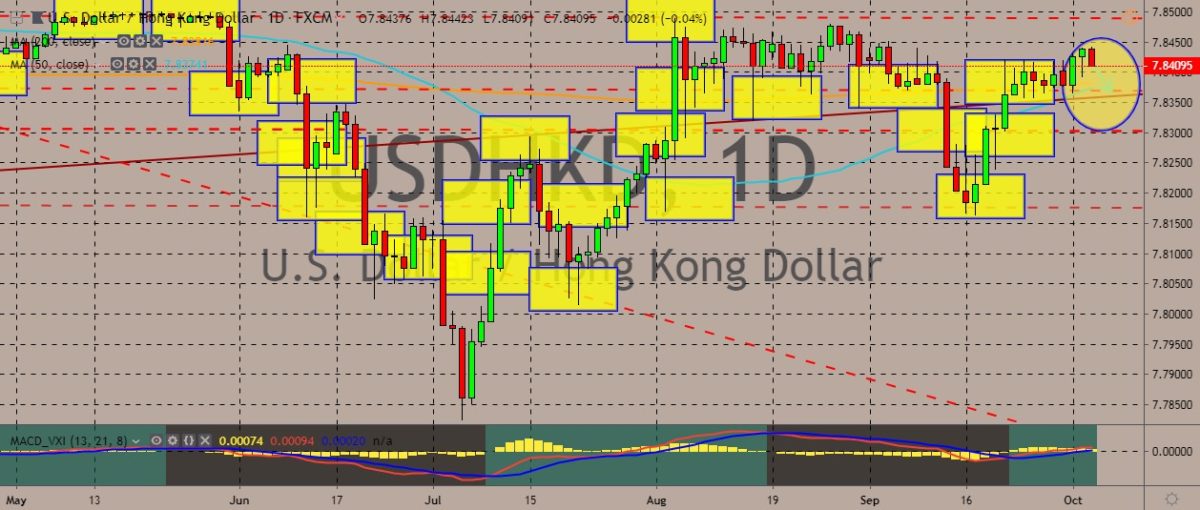
USDHKD
The pair is still trading above the key 50- and 200-day moving average, indicating that the Hong Kong dollar is still under pressure while the US dollar is gaining a lot from it. Hong Kong is still in the midst chaos as protesters continue the fight. HK anti-government demonstrators clashed with police force into the early hours of the day, expressing outrage over a policeman’s shooting and wounding a teenager at close range earlier in the week. As protests don’t show any signs of letting up, the city’s economy is taking damage, with retail sales declining by a record level in August. The protests have slammed the tourism industry. Visits from mainland China have fallen down 42% in August. The slump in this economic data is threatening to take away Hong Kong’s status as a shopping hub. The data showed that year-on-year decline in value of retail sales was 23%. According to one government spokesman, the result was the worst ever.


COMMENTS