

Here are the latest market charts and analysis for today. Check them out and know what’s happening in the market today.
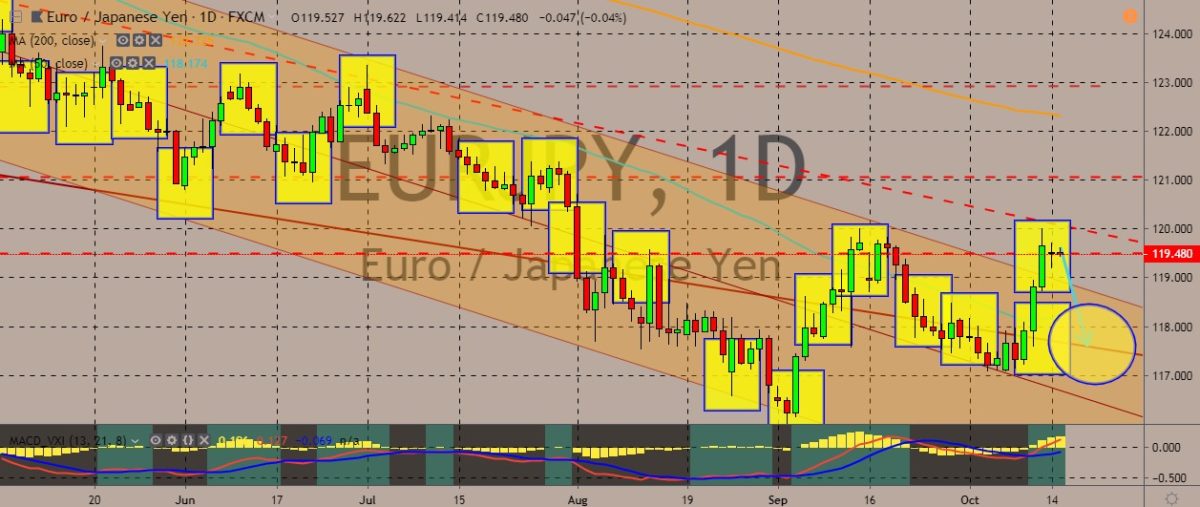
EURJPY
The pair managed a breakout above its trading channel in the previous three sessions, although after the breakout the trading volume has decreased, with the direction now biased on the downside. The price is trading above the 50-day moving average but lower than the 200-day counterpart. Over in the eurozone, economic data has not been good still. Industrial production only increased 0.4% in August. But this could translate to relief for both Germany and Italy. On the other hand, France saw a decline in the industrial activity, meaning it’s not really insulated against the global problems facing the industry. Over in Japan, Bank of Japan Governor Kuroda said that the central bank will maintain quantitative easing with yield curve control for as long as need to achieve the 2% inflation target. It will also keep short- and long-term rates at the current low levels for longer, or at least through the spring of 2020.
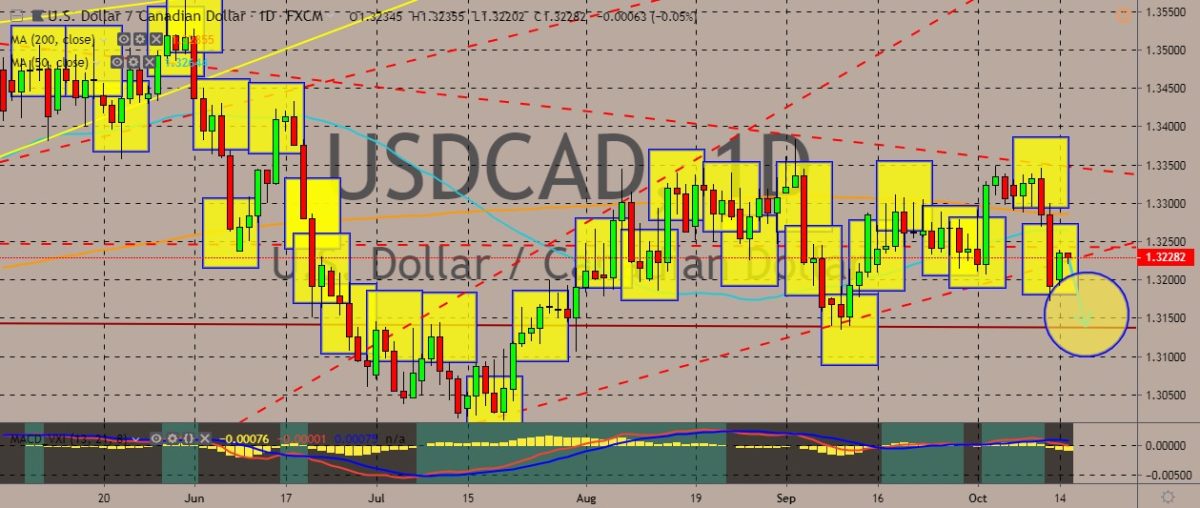
USDCAD
The pair is practically trading sideways on the daily chart, with the price reaching monthly lows in recent sessions before it pared some of the losses. It has fallen below the 200- and 50-day moving average, indicating generally bearish sentiment on the part of the traders. Traders appear to be struggling to break above a solid resistance line. Over in Canada, the recent employment report showed that unemployment rate dropped by 5.5% and added 54,000 jobs last September. The rate of employment climbed up in Ontario and Nova Scotia, while the rate was steady in the rest of the country. This marks the latest significant economic data before Canadians head to elections. As for the elections, Conservative Party Leader Andrew Scheer said yesterday that his government would not form a coalition government if the Conservatives won only a minority in the Canadian Federal Election.
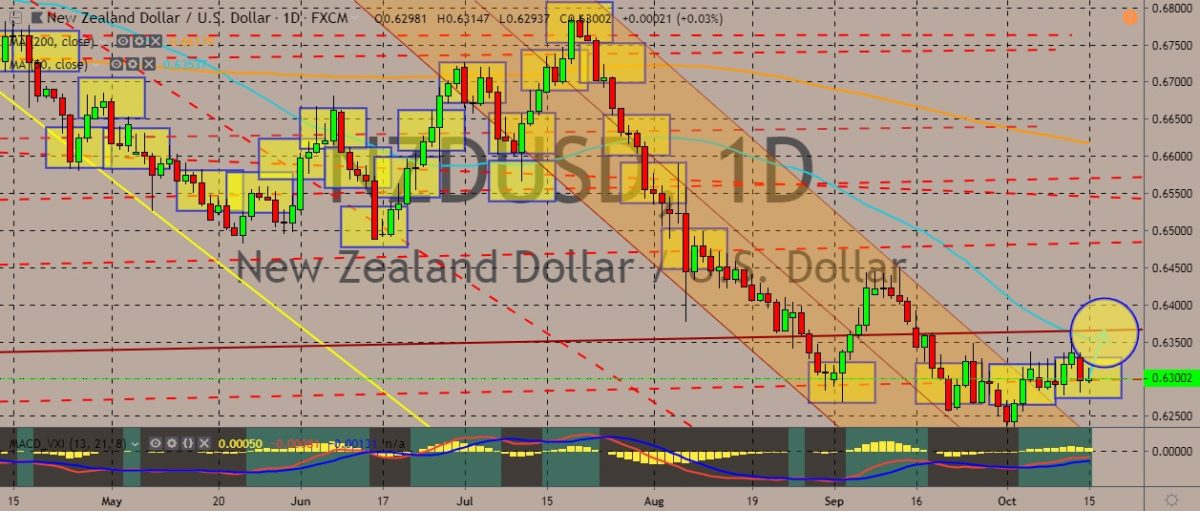
NZDUSD
The pair recently broke out from its down-trending trading channel, with prices apparently trying to perk up and go far above the support line. However, bulls are struggling to keep up the prices as it recently turned back down again, shying away from the 50-day moving average. This comes as most traders try to position themselves for the release of September quarter inflation figures this week. It’s very likely that the inflation figures will be on the weaker side. General consensus bets that consumer price index gained 0.6% in the most recent quarter, which means the annual inflation would be 1.4%, lower than the 1.7% recorded in the June quarter. The Reserve Bank of New Zealand aims for 2% annual inflation, and the broader market expect the bank to cut key rates again. Meanwhile, lackluster data from China, which is New Zealand’s largest trading partner, showed that exports and imports fell worse than market expectations.
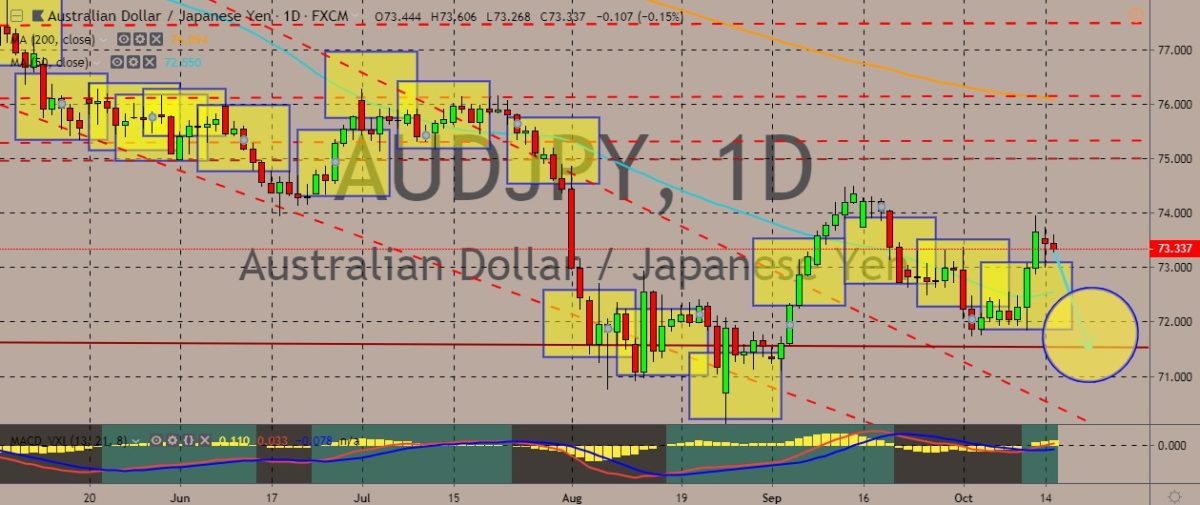
AUDJPY
The pair is trading in the red, although it managed to climb to weekly highs. It has also climbed up the 50-day moving average, but still far from the 200-day moving average. There’s really no clear trend right now for the pair, moving in huge peaks and valley. Over in Australia, minutes of the latest meeting of the Reserve Bank of Australia showed that the most recent interest rate cut was deeply debated among the board members. The minutes showed that some of the members feared that the October rate cut would drive up house prices and fail to deliver a boost to the economy. The minutes also showed that the main reasons for the October rate cut were the bank’s worries over unemployment, which it feared was not low enough to drive up wages, and the economy wide inflation. At the same time, the minutes showed that there was a growing anxiety about taking the interest rates so low.


COMMENTS