

Here are the latest market charts and analysis for today. Check them out and know what’s happening in the market today.
USDILS
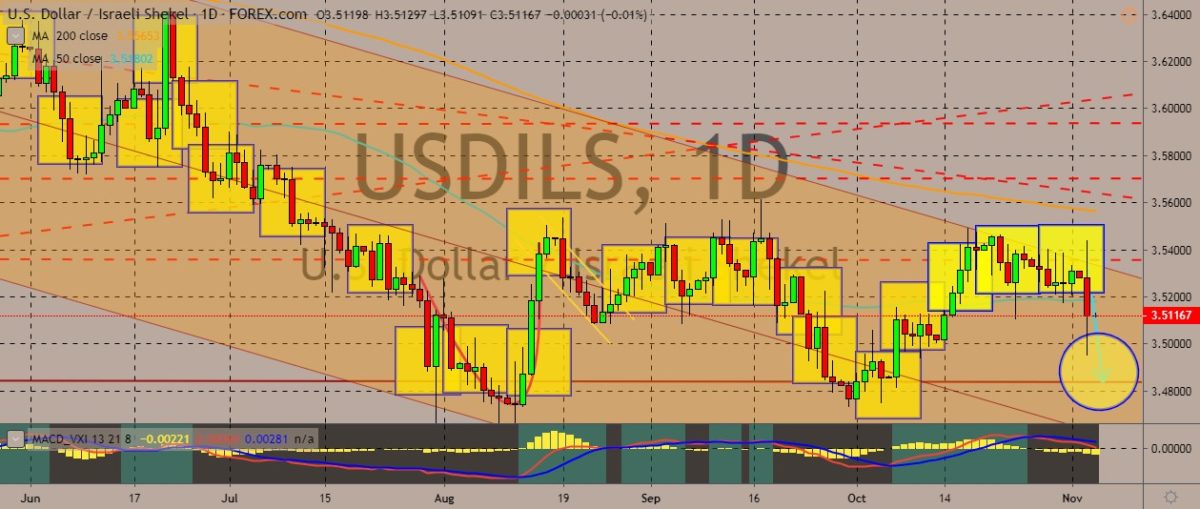
The pair is trading in the red again after it failed to break above the down-trending trading channel in the recent weeks. It last traded around the 50-day moving average area, with the price still biased to the downside. Last month, Bank of Israel Governor Amir Yaron indicated that the bank could lower interest rates next year if the global slowdown starts to affect the country’s economy. He also did not rule out the chances of negative rates. Meanwhile, Iran is reviving cries of “Death to America” as it marked the 40th anniversary of the 1979 student takeover of the US Embassy in Tehran as well as the 444-day hostage that followed. Tensions still persist over the country’s faltering nuclear deal with world powers. Demonstrators gathered in front of the previous US Embassy in Tehran. State television aired some shots from other cities in the country. However, mob attacks and violence also happened.
USDZAR
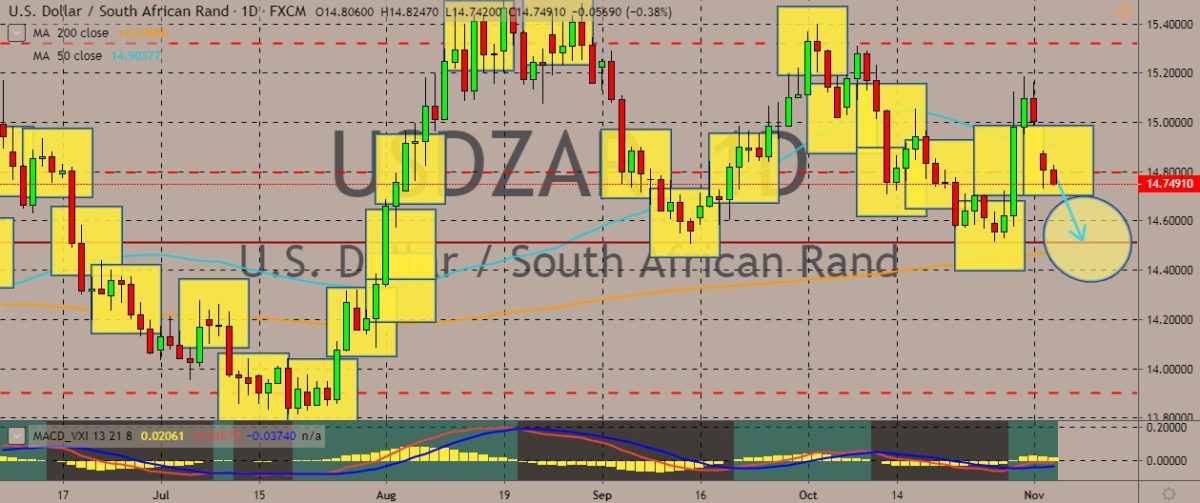
The pair is trading in the red after leaving a gap over the weekend, retracing much of its upside moves after it slipped below the 50-day moving average. The US dollar is still primarily driven by the developments over the US-China trade negotiations. Both countries have given some positive signals, with the US government reportedly considering removing some tariffs on Chinese goods. Other reports also suggested China is reviewing some places in the US to sign the so-called “Phase One” trade deal with US President Donald Trump. Meanwhile, South African exports to the US worth around R35 billion last year will be put on the line as the Office of the US Trade Representative kicks off a review of SA’s eligibility for duty-free imports. The plans for the review were announced last Friday. Should the review go negative for South African exports, it doesn’t mean the products won’t be sold duty-free in the US. It just means they will be pricier.
USDRUB
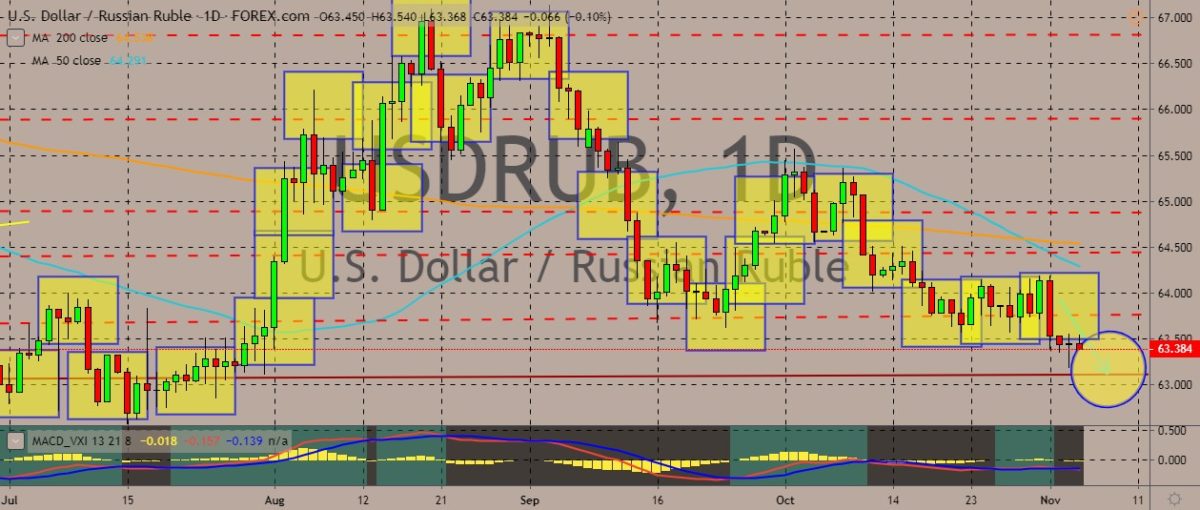
The pair has pulled back again from recent gains, slipping below a solid support line below the 64.000 and 63.000 level. Moving averages tell a bearish story, with the 50-day moving average crossing below the 200-day moving average, indicating that traders may continue pushing prices down. Recently, the Russian central bank slashed interest rates by 0.5 percentage point to 6.5%, pointing to the lower-than-expected inflation rate. Annual consumer price growth slipped from 4.3% in August to 4% in September. As for political relations, former Soviet premier Mikhail Gorbachev has warned that the tensions between nuclear powers is putting the world at risk. He then called for the international community to outlaw weapons of mass destruction. During his term in the Soviet Union, Gorbachev worked with US officials to limit nuclear development and ease the Cold War tensions between the US and Russia.
EURCHF
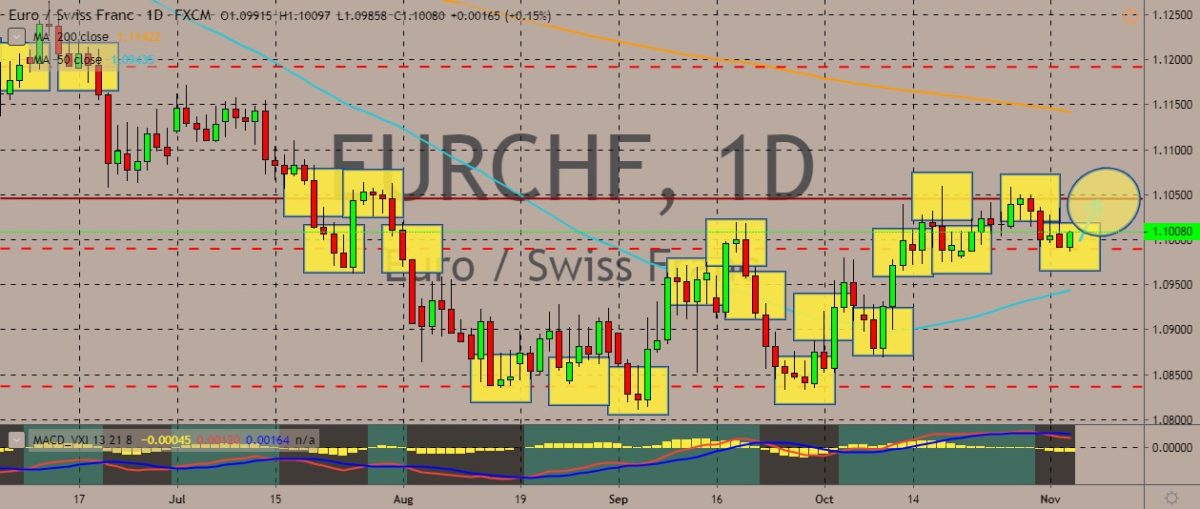
The pair is trading in the green, paring its losses in the previous trading session and still hovering near monthly highs. For economics, the Swiss economy growth will probably slow to 0.8% this year and lower than the country’s long-term average next year, according to the Organization for Economic Cooperation and Development. It pointed to increasing risks from low interest rates and overseas trade tensions. At the same time, the slowdown in the European economy will also drag the country and decrease growth from 2.8% last year. For 2020, the OECD predicts Swiss growth at 1.4% below the long-term average of 1.7%. It will also be lower than the government’s own forecast for an expansion of 1.7% next year. The OECD added that the low interest rates in the country contributes to the dangers in the housing market. interest rate-related risks also loom large in the financial sector. The Swiss National Bank has a negative rate of -0.75%.


COMMENTS