

Here are the latest market charts and analysis for today. Check them out and know what’s happening in the market today.
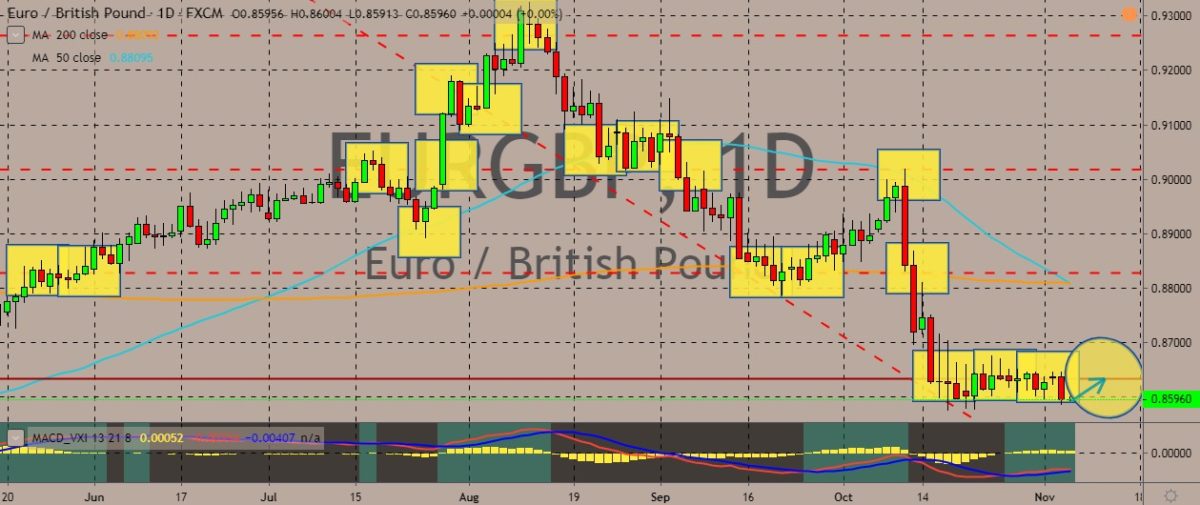
EURGBP
The slipped steeply in the previous session as the prices continue sideways. It trades above and below the current support line, although past data suggests that this could be a downtrend for the pair, with lower highs and lower lows being recorded since August. The primary driver of price movement is still the Brexit saga. Recently, the British pound enjoyed fresh boosts after some progress in the Brexit negotiation, hence the lower lows and lower highs. However, more recently, fresh concerns bugged the GBP and put British Prime Minister Boris Johnson. Johnson appears to be trying to use Brexit as an electoral weapon against Labour Party leader Jeremy Corbin. Pressures now mount as claims surface that he could pull Britain out of the EU without a trade deal in December 2020. Johnson insists that he complete the Brexit ratification by January 2020, and then negotiate a free trade deal with the EU by the end of next December.
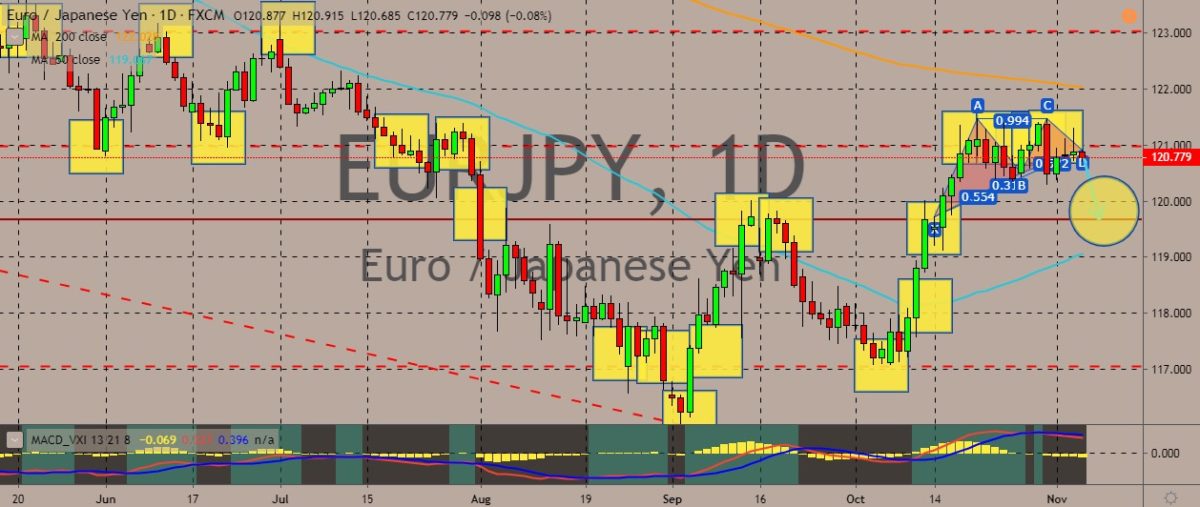
EURJPY
The pair recently paused its uptrend, with the price nearing the double-top neckline level. Generally, the impression it gives is that it would be ready for a reversal soon if the price fails to continue its uptrend. Price drivers include the status of the European Central Bank under its new head, Christine Lagarde, who delivered her first speech as the ECB president yesterday. In the speech, Lagarde used the opportunity to reach out to the critics of quantitative easing. She made no reference to monetary policy, however. Lagarde also reiterated calls for more expansionary German budget. Over in Japan, Bank of Japan Governor Haruhiko Kuroda said that the additional monetary policy by the BOJ won’t be limited to interest rate cuts. On top of that, he added that the economy would still stay firm in spite of the recent hike in consumption tax. Last week, the BOJ kept benchmark rates unchanged, but gave stronger signals of cutting rates if necessary.
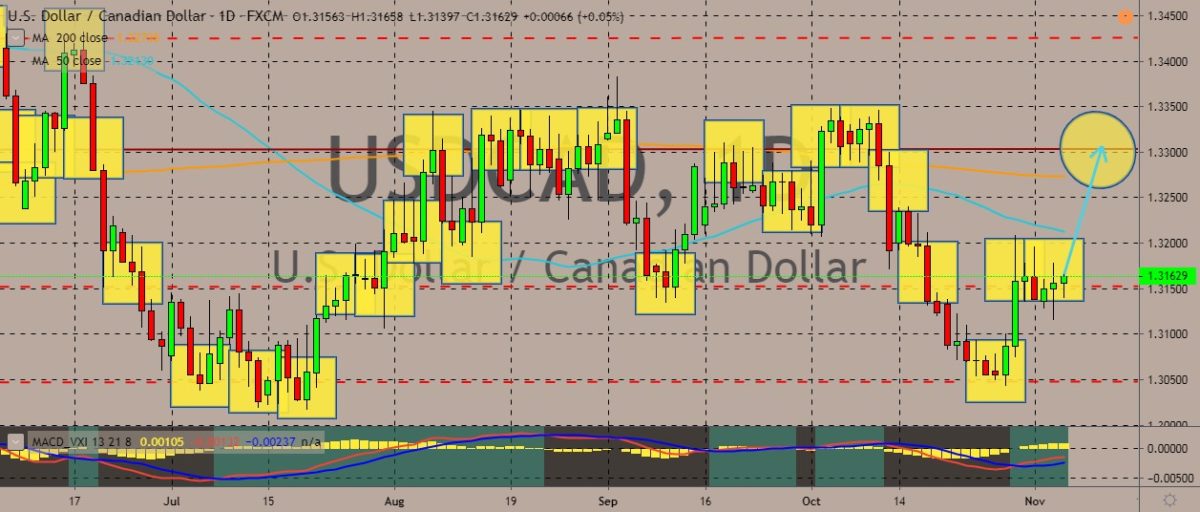
USDCAD
The pair is trading in the green in the previous sessions, with the price coming closer to the 50-day moving average by breaking above the key resistance line. For fundamentals, Canada’s September trade deficit shrank to 978 million Canadian dollars, or $745 million, with imports falling faster than exports. This essentially ends the third quarter on a weak note. According to Statistics Canada, lower shipments of energy products helped cut the value of exports by 2.3% in the third quarter after they increased 4.8% during the second quarter. In the previous week, the Bank of Canada said that the country wasn’t immune to global trade conflicts like the trade war between the US and China. The import and export data helped boost the Canadian dollar against its US counterpart in the sessions, but the pair still closed in favor of the buck in the previous session. According to one economist, the report may be soft, but it was largely expected and not worse than feared.
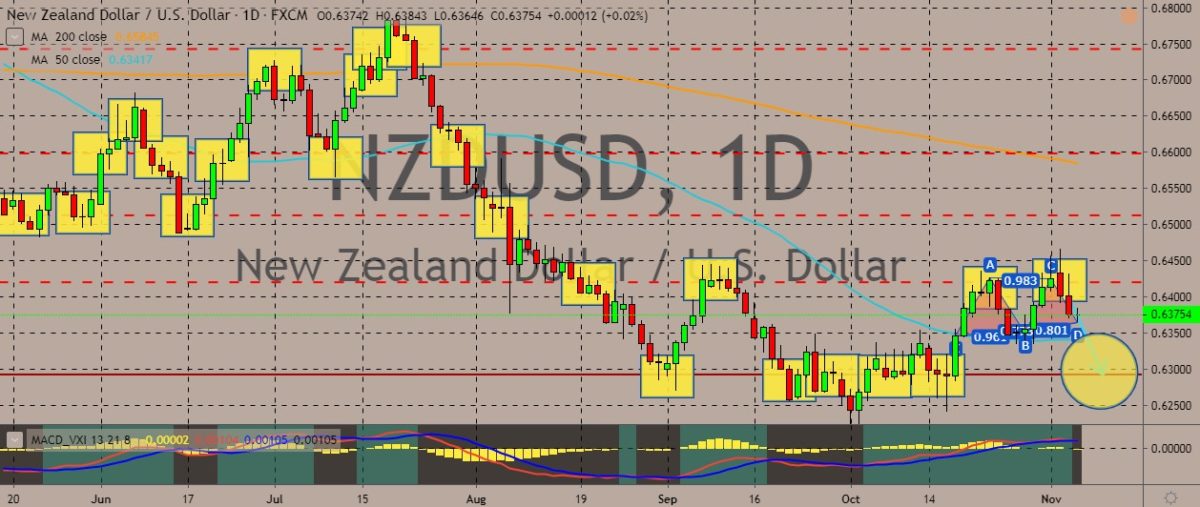
NZDUSD
The pair is trading in the red, creeping closer to the 50-day moving average on the daily chart. It appears ready to the finish a double top pattern, and if it plunges below the 50-day MA line, it’s possible the pair will suffer even more bearishness among traders. As for fundamentals, New Zealand recently got its unemployment rate data, which showed it edged up 4.2% during the third quarter. This is taken as a sign that the country’s slower economic growth is starting to show up in the employment market. According to Statistics New Zealand, the unemployment rate climbed from an 11-year low of 3.9%. Meanwhile, employment growth was slower than markets have expected, with a sluggish rate of 0.2%. Analysts expected that rate to be 0.3%. This data will be taken and examined by the Reserve Bank of New Zealand, which is due to release its final monetary policy decision for this year next week.


COMMENTS