

Here are the latest market charts and analysis for today. Check them out and know what’s happening in the market today.

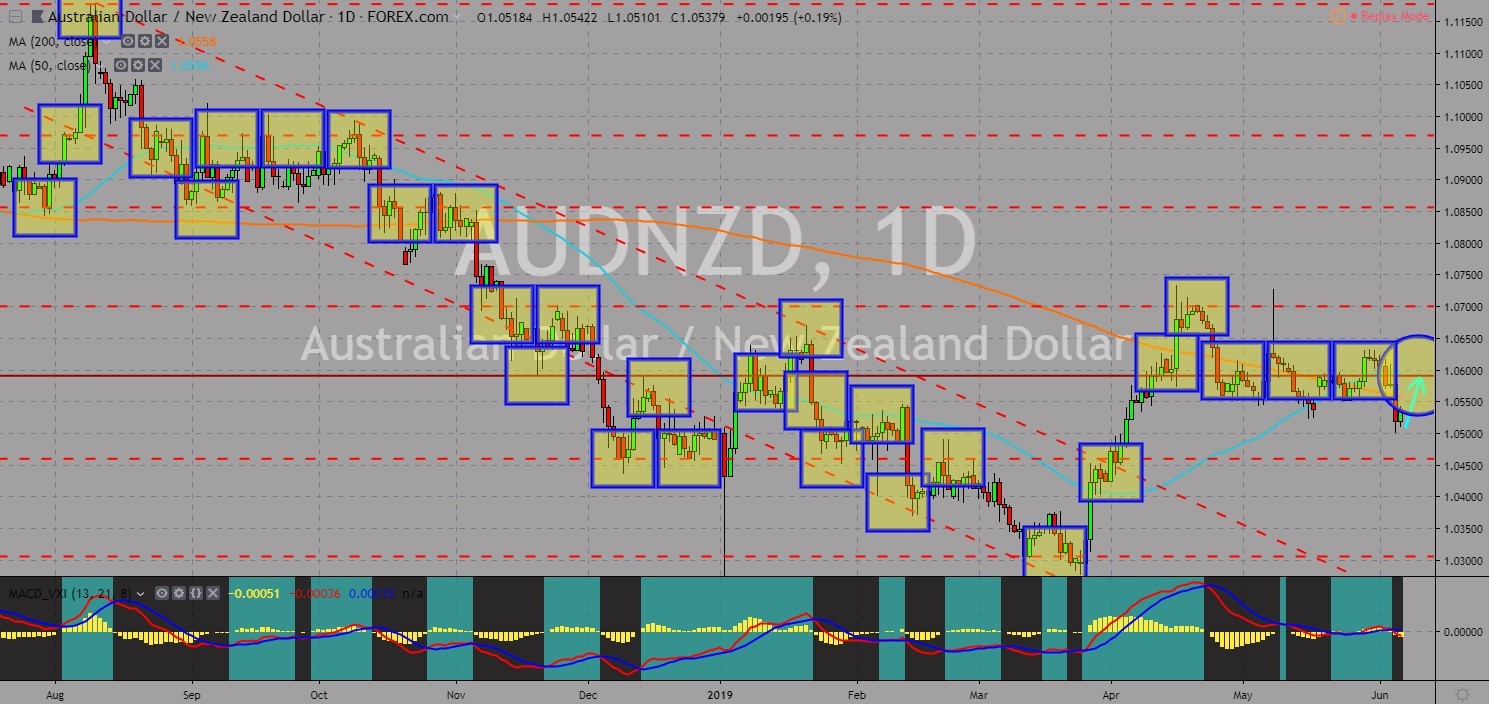
AUDNZD
The pair was seen to continue moving higher towards the resistance line following the crossover between MAs 200 and 50, which created the “Golden Cross”. The recent visit by U.S. President Donald Trump to the United Kingdom signified the strengthening relationship between the two (2) countries with the UK withdrawing from the EU until October 31. Aside from this, UK Prime Minister will be resigning today to pave way for a new PM to deliver the Brexit as PM May unsuccessfully delivered three (3) deals to which the British Parliament had rejected. The partnership between the United States and the United Kingdom will not be beneficial for New Zealand after Prime Minister Jacinda Ardern call out the U.S. and the UK and said that New Zealand’s decisions will not be affected by these countries. This will push New Zealand to the European Union. Histogram and EMAs 13 and 21 was seen to reverse.
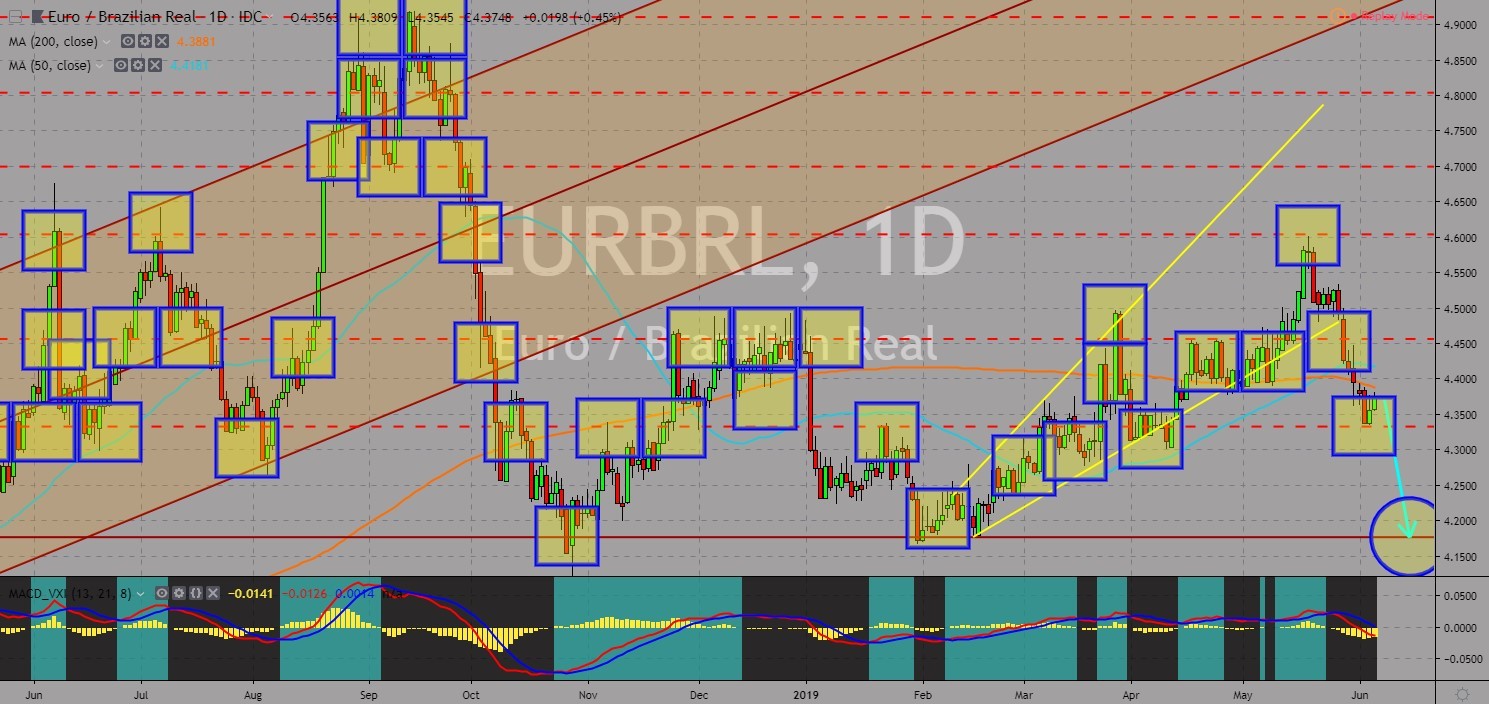
EURBRL
The pair was expected to break down from its support line after it broke down from MAs 50 and 200. Brazilian President Jair Bolsonaro and Argentine President Mauricio Macri expressed their confidence about the Southern Common Market (Mercosur) Deal signing a free trade agreement with the European Union. The Mercosur Deal was the largest trading bloc in South America, while the EU represents the largest trading bloc in the world. The European Union had also ratified the EU-Japan Free Trade Deal, which became the largest trading zone in the world. Despite this, however, are worried with the slowdown in the global growth, particularly in the European Union, but had expressed their optimism with Brazil leading South America and opening up their market. Brazil was also exporting to both the United States and China. Histogram and EMAs 13 and 21 will continue to move lower.
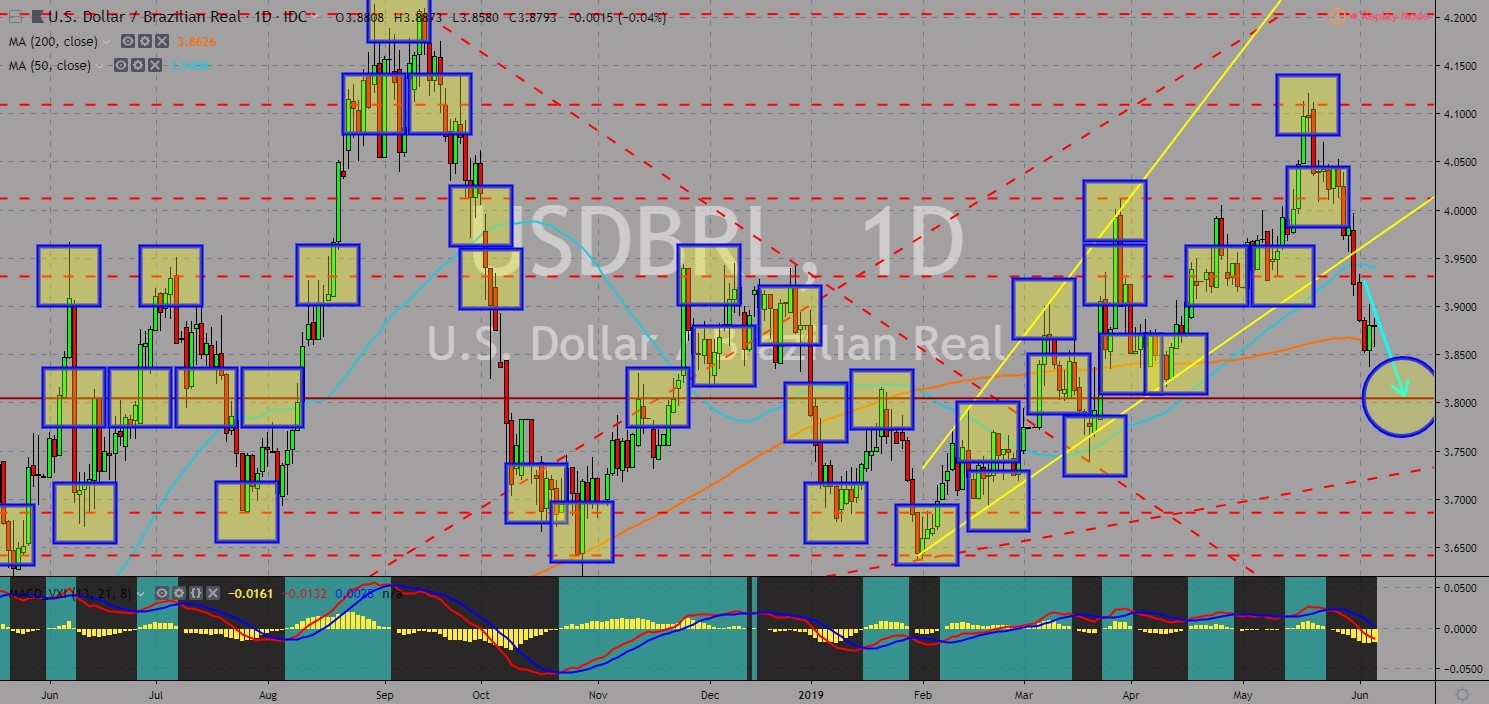
USDBRL
The pair was seen to continue its steep decline and to breakout from 200 MA, sending the pair lower towards the nearest support line. Before U.S. President Donald Trump and Chinese President Xi Jinping agreed to a trade truce during the G20 Leaders Summit in December 2018, Brazil appears to be the winner during the trade war between the two (2) largest economies in the world. Now that the trade war remains unresolved, with the United States and China engaged in a tit-for-tat war, Brazil was once again benefiting. The United States and Brazil were major exporters of Soybean. The trade war had forced China to shift its import from the U.S. to Brazil, with Brazil accounting for 80% of China’s total import of Soybeans and was expected to continue until the two (2) countries agreed to another trade truce, which was far from possible to this date. Histogram and EMAs 13 and 21 will continue to move lower in the following days.
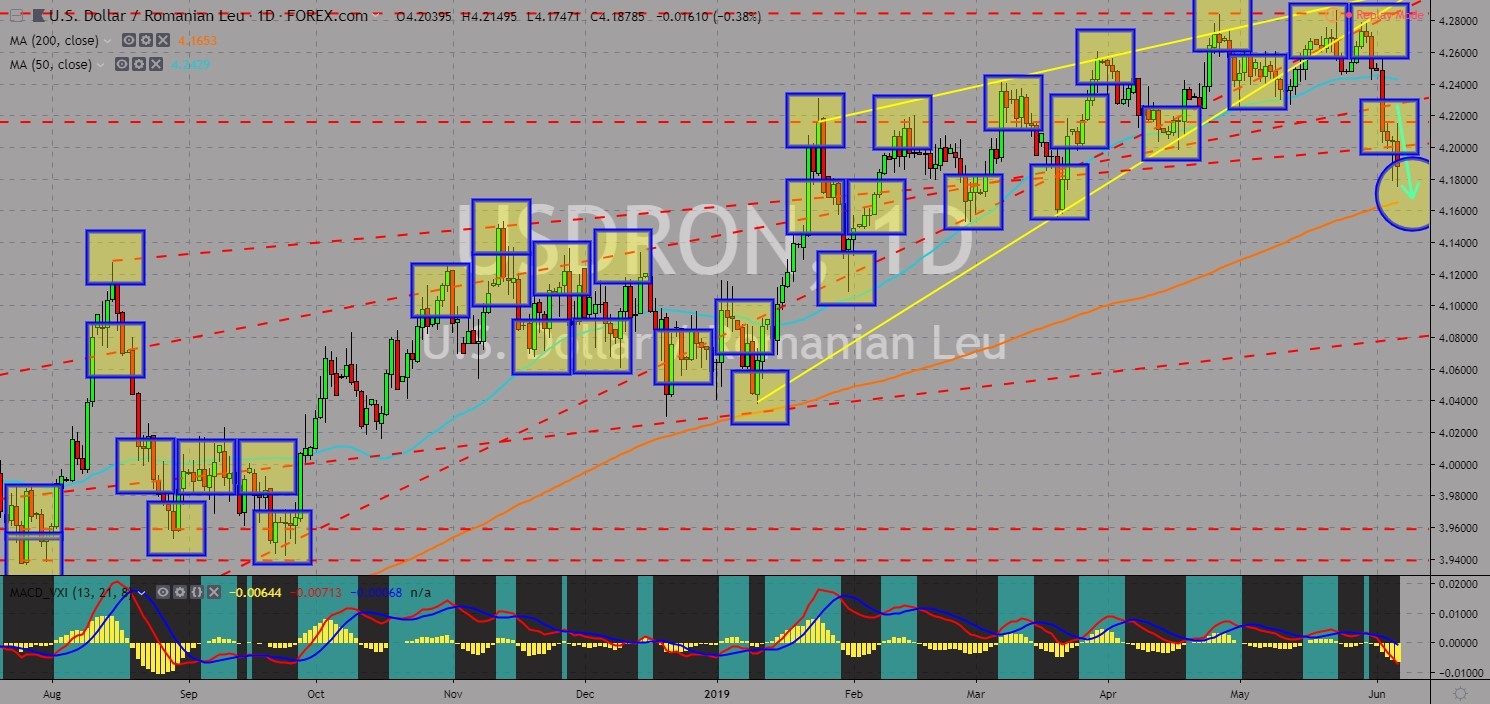
USDRON
The pair was expected to move lower towards 200 MA after it broke down from several support lines. Following the fallout of the relationship between the United States and the European Union, the United States was seen lobbying non-EU European countries and even some EU-member states, particularly the Eastern and Nationalist bloc, the Visegrad Group. Aside from this, the rift between the U.S. and Turkey had forced the United States to look forward to its European allies to fortify its defense against Russia. The U.S. said it was planning to sell the F-35 fighter jets from Turkey to Romania. In line with this, Romanian President Klaus Iohannis has called on the ruling left-wing government to honor referendum results and reverse a series of measures to weaken the judiciary and the rule of law that have been criticized by the European Union and United States. Histogram and EMAs 13 and 21 were poised to move lower.


COMMENTS