
If you have ever experienced forex trading, you might have come across candlesticks. What are these candle-shaped charts? How can we read them?
Apparently, candlesticks are one of the most valuable charts traders use for market analysis. In this article, we will provide basic details that will help you read, use, analyze market updates with the candlesticks.
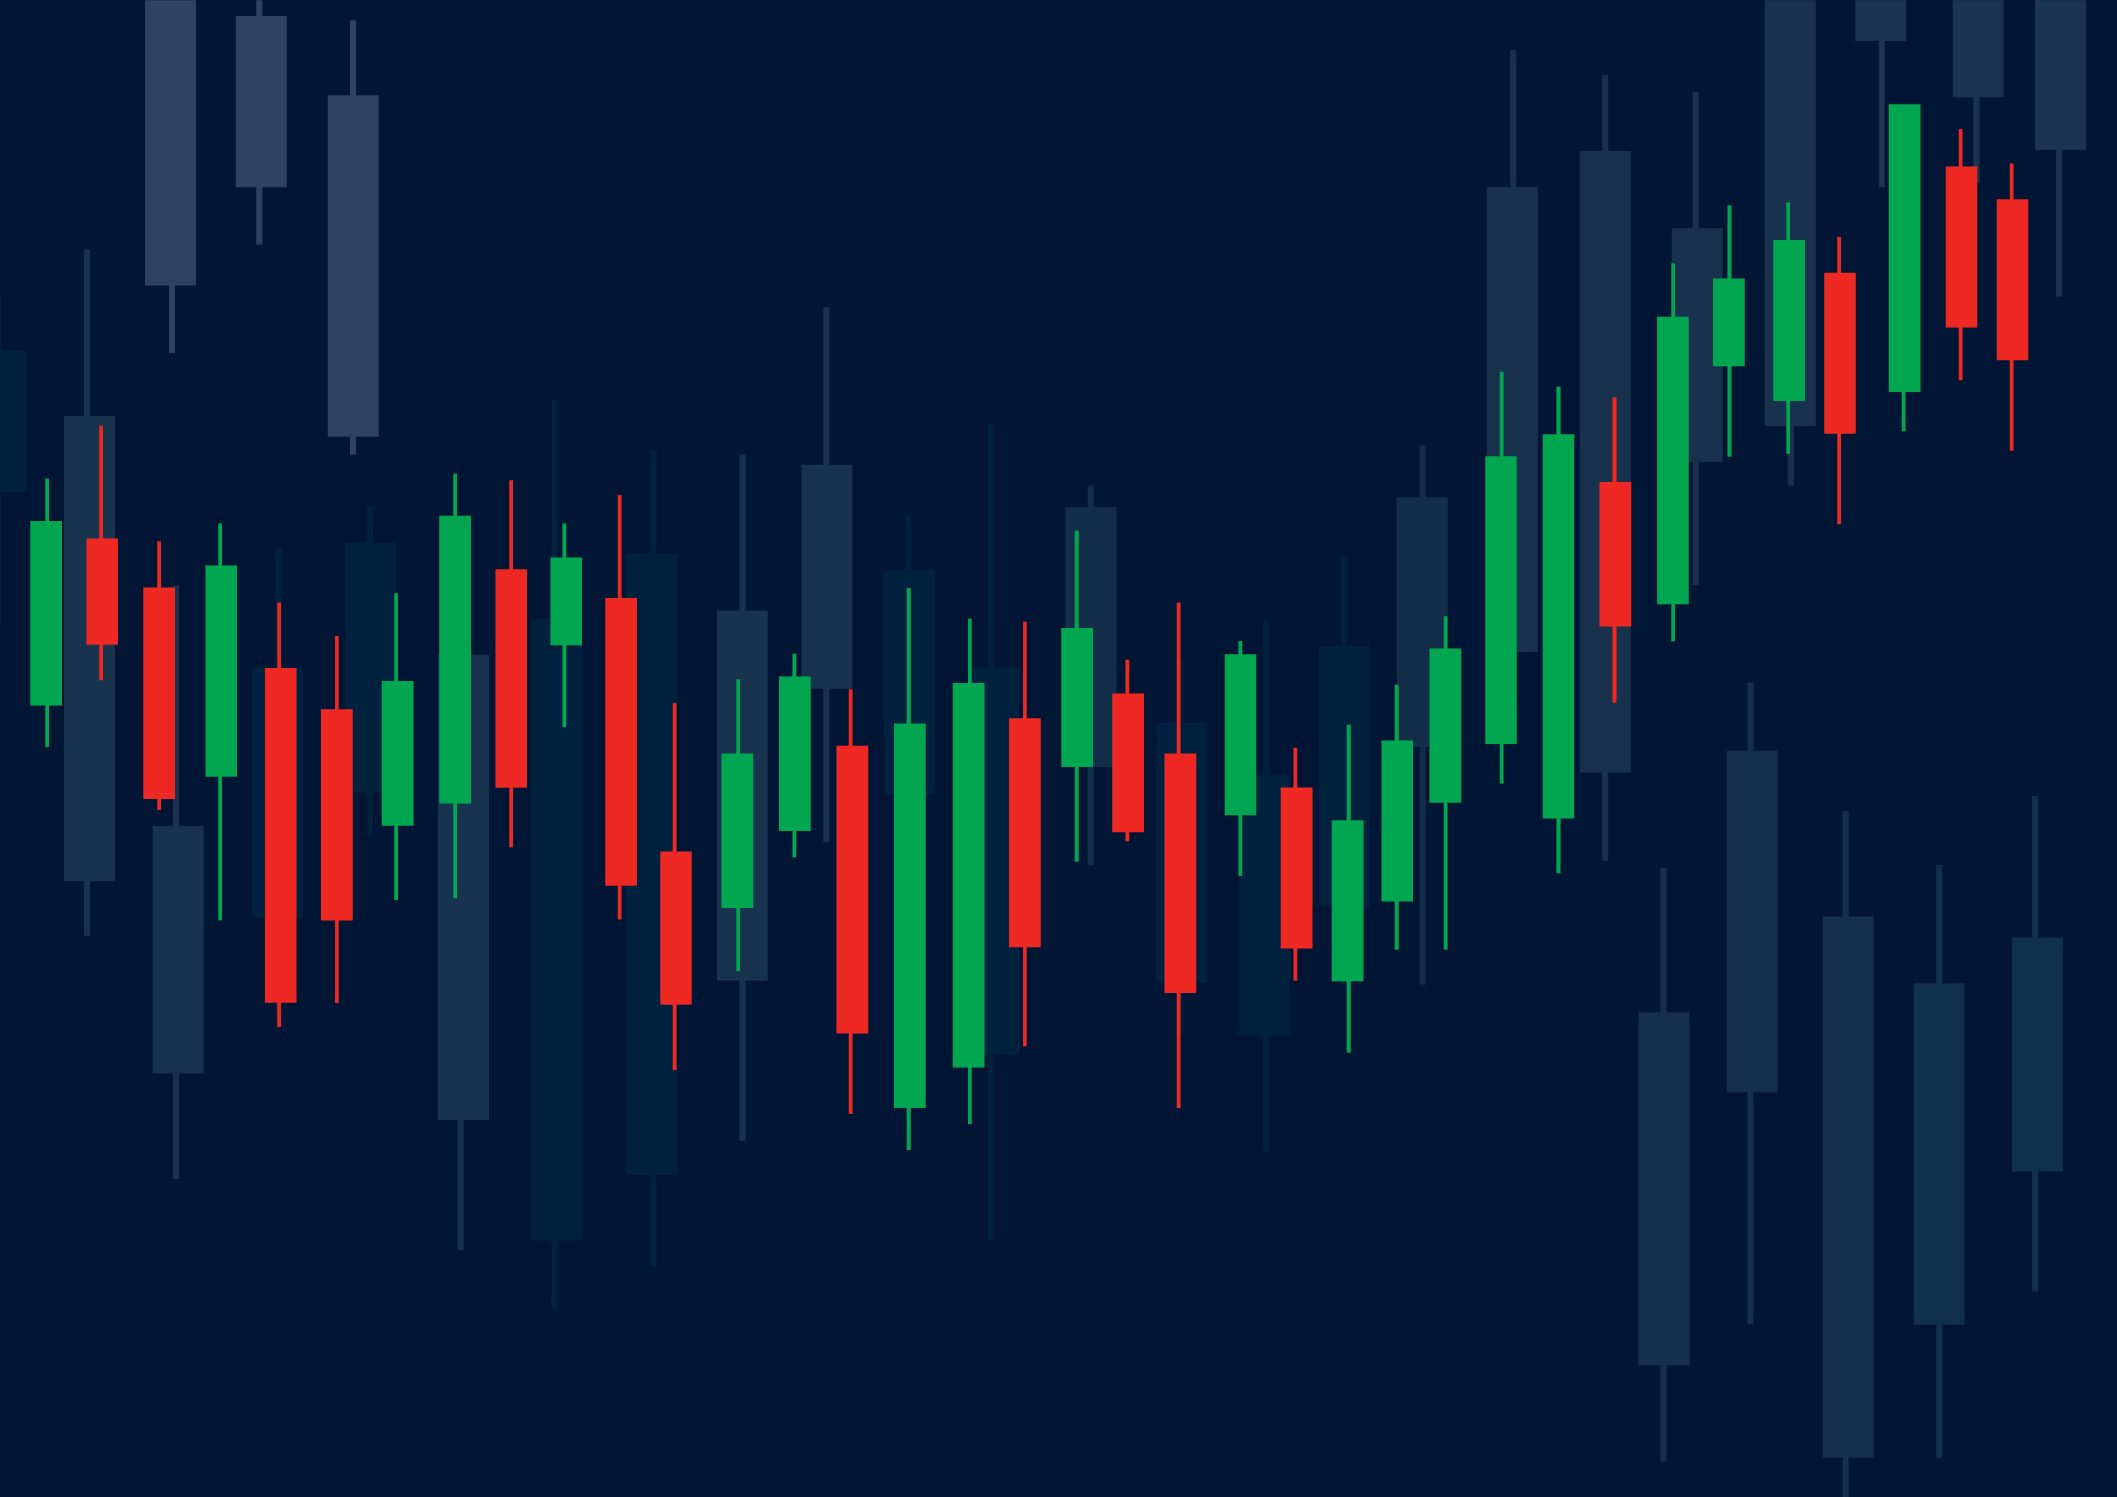
What are candlesticks?
A candlestick chart is just a chart composed of a single candle, and traders use it to understand price behavior. Candlestick price behavior involves determining the opening position of the price within a period of time, the closing position of the price within a period of time, and the high and low points of the price within a specific period of time.
Price movements can provide traders in all financial markets with clues to trends and reversals. For example, a group of candlesticks can form a pattern that appears in the entire forex chart and can indicate a reversal or continuation of a trend. Candlesticks can also create a different pattern, showing a buy or sell entry in the market.
Understanding candlestick’s body parts
The candlestick consists of the upper shadow line, the lower shadow line, and the main body. The body is green or red. Each candlestick represents a segmented time period. Simply put, the candlestick data gathers and concludes the trades executed during that particular time.
For instance, a 15-minute candle represents the trading data of that 15 minutes. Each candlestick has four data points: opening, highest, lowest, and closing. The opening is the first transaction in a specific period, and the closing is the last transaction.
The opening and closing are considered the main body of the candle. The high price is the highest price transaction, and the low price is the lowest transaction during the period.
A vertical line demonstrates the high point. This line extends from the top of the body to the highest price, and its name is the shadow, tail, or wick. The low point of the candle is the lower shadow or tail, represented by the vertical line extending downward from the main body.
If the closing price is higher than the opening price, the main body is green, which means the net price has risen. If the opening price is higher than the closing price, the subject is red because it represents a decrease in the net price.
What factors do you need to consider while using candlesticks?
Simply put, every candlestick is a story of a relationship between bulls and bears, buyers and sellers, supply and demand, fear and greed. It is important to remember that most candlesticks need to be confirmed based on the context of the previous candlestick and subsequent candlesticks.
A common mistake made by many novices is to discover a single candle pattern without considering the context.
For example, suppose a hammer candle forms after three previous bearish candles. In that case, it represents a recent surrender bottom, while a hammer candle formed on a “flat” side candle is basically useless.
Therefore, it is necessary to understand the “story” represented by each candle to grasp the candlestick chart pattern’s mechanism firmly.
These patterns tend to repeat continuously, but when the context is ignored, the market will often try to deceive traders in the same way.
Because of the color of the body, candlestick charts tend to represent more emotions. It is prudent to ensure that they are combined with other indicators to achieve the best results. Here are some common candlestick reversal patterns.
How to read the candlestick chart
There are many ways to use and read the candlestick chart. Your preferred trading strategy and time frame define the candlestick chart analysis. Some methods try to use candlestick patterns, while others try to identify price patterns.
Analyze the formation of a single candle
A single candlestick can provide a lot of insight into the current market sentiment. Candlesticks like hammers, meteors, and hangers offer potential clues about the momentum of change and possible trends in market prices.
The Hammer candlestick pattern sometimes indicates a trend reversal. The hammer candle is formed with a longer lower wick and a small body.
Its opening price tends to be lower than its closing price. The basic prediction of hammer patterns is relatively easy. In the hammer pattern’s case, the price tries to drop while buyers enter the market to increase the price. This is a bullish signal to enter the market, tighten stops, or close short positions.
Once the hammer candle closes, traders can take advantage of the hammer pattern by executing long trades. Hammer candles are advantageous because traders can implement “strict” stop losses (stop losses with few pip risks).
The placement of taking profit should ensure a favorable risk-reward ratio. Thus, the take profit is higher than the stop loss.
Identify the price pattern of multiple candlesticks
The candlestick chart helps traders identify the price patterns that appear in the chart. By identifying these price patterns, such as bullish engulfing patterns or triangle patterns, you can use them as signals to enter or exit the market.
For example, the Bullish engulfing pattern combines red and blue candles, which “engulfs” the entire red candle. This indicates that the currency pair may end its weakness. Traders can use this to establish a long position after the blue candle closes. Remember that the price pattern is only forming after the second candle closes.
Bottom line
Theoretically speaking, candlestick basics might have sound complicated. However, while practicing, they are pretty easy to understand and use. We hope our article will help you understand the general terms, characters, and usage of candlesticks.
However, keep in mind that candlestick’s provided information is not always 100% accurate. The trading industry consists of high risks to your capital. Be cautious of these risks before you start trading and then enjoy your experience.


COMMENTS