

Have you recently thought about what the Candle pattern cheat sheet represents? Why are they so crucial to comprehend as a serious trading professional nowadays? First, navigating trading without the candlestick chart is like flying blind.
Candlesticks offer valuable predictive insights, yet waiting for the following candles to confirm a particular pattern is often crucial before acting on it. Often, candlestick patterns reflect market uncertainty, signaling traders about a possible shift in trend.
Traders focused on Price Action use Candlesticks to interpret market movements and gauge market sentiment.
So, why are these patterns so important, and how to recognize them? Before learning more about the Candle pattern cheat sheet, let’s get all the basic information about candlestick patterns here!
Understanding Candle Patterns cheat sheet
Diving into the ultimate candlestick pattern cheat sheet to understand price action is crucial for traders.
Each candlestick, with its body, shows the open and close range. The wicks or shadows reveal the high and low prices.
What are the neutral Forex candlestick patterns?
Candle patterns cheat sheets are neutral candles. Here is how you can understand them better:
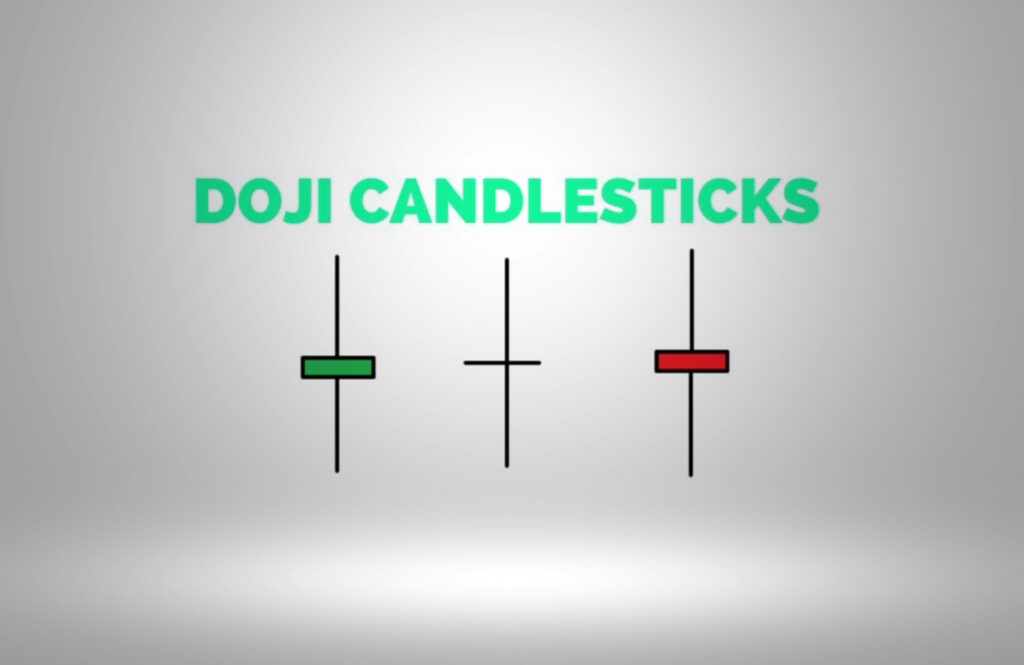
Doji
The Doji Candlestick formation displays an upper and lower wick, with either a minuscule body or no noticeable body.
A unique feature of the Doji Candlestick is its nearly identical Open and Closed values, resulting in no discernible body or just a tiny one, as depicted in this representation. Put more plainly, the Doji lacks a green or red shade due to the near-identical Open and Close values.
Spinning Top
The subsequent Unbiased Candlestick Formation is the Spinning Top. This formation exhibits a compact body, typically situated midway between the upper and lower wicks.
The Open and Close values are almost identical, making the body diminutive. Additionally, the body is positioned roughly at the midpoint of the upper and lower wicks.
How Do Candlesticks Take Shape?
Candlesticks can be categorized into three primary interpretations: bullish, bearish, and neutral. While this is a generalized view, the specific context of the candle’s formation is crucial. Nonetheless, for simplicity, we’ll focus on these three classifications.
Bullish and bearish trend
A green or white candle indicates a bullish trend with a higher close, while a red or black suggests a bearish trend. Hollow candles, whether white or grey, hint at bullish momentum, whereas filled ones, such as red or black, hint at a bearish reversal.
The red-hollow candlestick is a bullish reversal sign. Grasp these patterns with our technical analysis guide for better trading insights.
Deciphering Bullish Candles
A bullish candle arises when there’s a positive price movement, with the close price surpassing the open. Often, these patterns precede ascending triangles, indicating upward momentum. Bullish candles are usually filled with green or white, representing strong support levels.
The absence of an upper shadow combined with long candle wicks may signal a bullish engulfing pattern, a pivotal trend reversal.
While bar charts are simpler, candlestick patterns offer a deeper dive into support and resistance.
Understanding Bearish Candles
A bearish candle indicates the close price is below the open, hinting at a downtrend. Such candles often foreshadow descending triangles.
The upper shadow and candle wicks can suggest bearish reversal patterns, advising traders to enter a short.
Typically shown as red or black, these candles become significant when breaching resistance levels, hinting at double bottoms and trend reversals. Recognizing these patterns helps in forecasting price shifts.
Reversal Candlestick Patterns
Bullish and bearish patterns are categorized here, specifically highlighting those suggesting a trend reversal.
Understanding them in this light is beneficial, showing potential points for trade entry or exit. This strategy allows for securing profits or strategically changing direction.
The Reversal Candlestick Pattern Cheat Sheet serves as a handy reference.
Continuation Candlestick Patterns

Candlesticks don’t just signal reversals; they also pinpoint when markets are set to maintain their current trend.
Patterns here provide opportunities to:
- Engage in a trend you might’ve missed earlier.
- Enhance your current trade stance, capitalizing on the prevailing trend.
Key Points of Candlestick Patterns
- Open: On bullish candles, it’s the body’s bottom; on bearish, it’s the top.
- Close: For bullish candles, it’s the body’s top; for bearish, it’s the bottom.
- High: Indicates the session’s peak price.
- Low: Reflects the session’s lowest price.
Why is the candle pattern cheat sheet so important?
Candle pattern cheat sheet examples and candlesticks are crucial for numerous reasons. First, there are many ways to profit in the stock market, and while interpreting a chart might seem subjective, decisions anchored in data are pivotal.
Candlestick patterns, with their green, white, red candle, and black candles, offer a visual language of trading patterns.
These patterns can guide decisions
To a novice, a bearish chart with red or black-filled candles might seem cryptic, while a series of green or white candles might be confusing. But these patterns, like road signs on bustling streets, can guide decisions.
Also, a red candlestick on a price chart signifies that the security’s closing price was lower than both its opening price and its prior closing price.
Grey and green candles tell unique market tales.

The grey candles, alongside the green candle, each have their unique tales in the market’s narrative.
With persistence and practice, these patterns become your roadmap in the intricate trading landscape, guiding you towards potential profitability. Delving into this knowledge is a journey truly worth embarking on.
What Does the Candle’s Structure Reveal?
Simply noting the opening and closing price of a candlestick isn’t enough. As a prominent trading expert, Dr Alexander Elder points out, the key lies in understanding the tug of war between those who set the opening price and those who determine the close.
This dynamic is evident even in patterns like descending triangles, where filled candlesticks can offer deeper insights into market sentiment.
What are the five essential candlestick patterns?
If you’re interested in learning about Candle Pattern Cheat Sheet, let’s take a look what are five essential candlestick patterns first.
Mastering candlestick patterns requires both understanding and hands-on practice. Here’s a concise look at five pivotal patterns:
Hammer / Hanging Man
Hanging Man: After a price rally, it showcases strong selling during its formation, often coupled with high volume. It signifies a potential price reversal when the candle closes.
– Hammer: Resembles the Hanging Man but surfaces after a selloff, highlighting a potential uptrend.
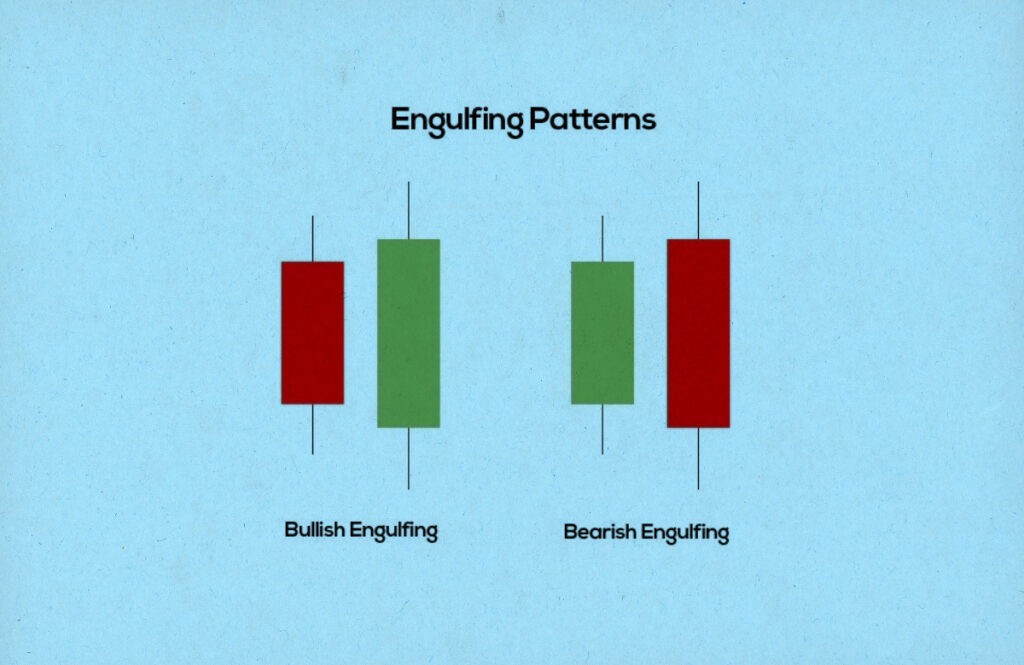
Engulfing Patterns
– Bullish Engulfing: A bullish candle completely engulfs its predecessor, pointing to strong demand.
– Bearish Engulfing Sandwich: A bearish reversal followed by a dominant bullish candle.
Morning Star
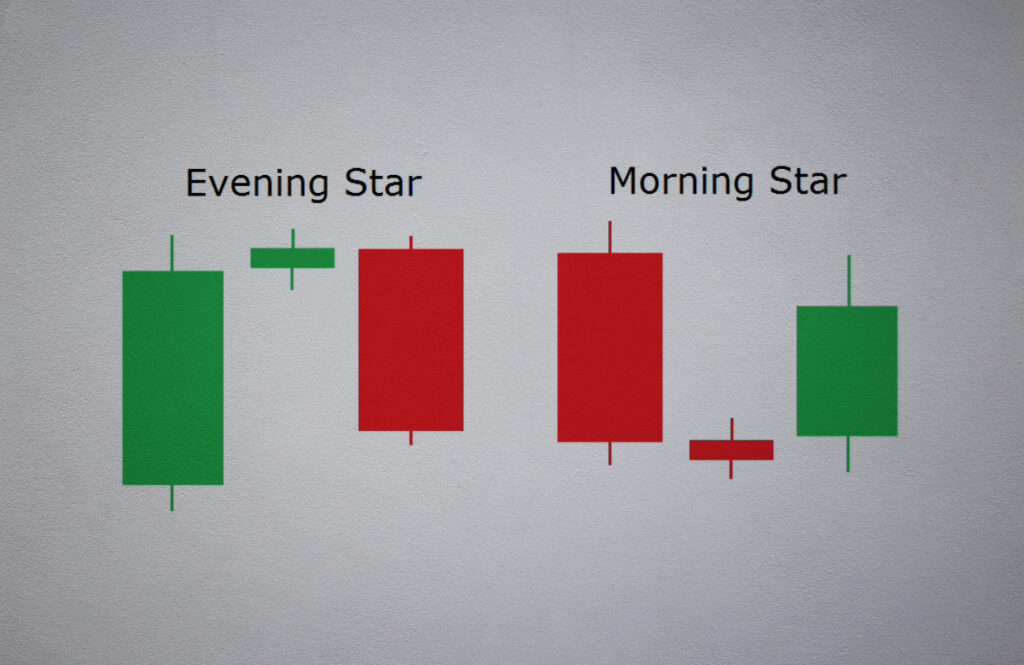
Indicates bullish reversal at a downtrend’s end. Comprises a downtrending candle, a narrow star, and a bullish confirmation.
Evening Star
The bearish equivalent to the Morning Star. Criteria: distinct bodies, a conclusive bearish candle, and rising volume.
Indecision Candles
Including the doji and spinning top, they suggest market uncertainty. Gravestone Doji is a prime example.
These patterns guide traders on optimal entry, exit, and risk management.
Perfecting Your Skills with Candlestick Patterns: A Bottom Line
Before investing real money, it’s crucial to familiarize yourself with strategies. A simulator serves as an excellent tool for this purpose.
To sharpen your recognition of patterns, replay market charts and pinpoint each candle pattern you observe. Utilize the “Candle pattern cheat sheet” for assistance.
During your focused practice, pose these questions:
- Which candle pattern is this?
- What’s the market trend? Rising? Falling? Stagnant?
- Is this candle indicative of a valid reversal?
- At what point is entry least risky?
- What would validate this pattern?
FAQ – Candle Patterns cheat sheet
What are candlestick patterns?
They’re visual charts that represent price movements, showcasing open, close, high, and low prices for a set period.
Why are candlestick patterns important for traders?
They provide insights into potential price trends, market sentiment, and support/resistance levels.
How do you differentiate between bullish and bearish candlesticks?
Green/white candles indicate bullish trends; red/black signify bearish trends.
Name some common reversal candlestick patterns?
Examples include Hammer, Hanging Man, Bullish Engulfing, and Morning Star.
How can traders refine their candlestick interpretation skills?
Use a simulator and the “Candle pattern cheat sheet” to practice and validate observations.


COMMENTS