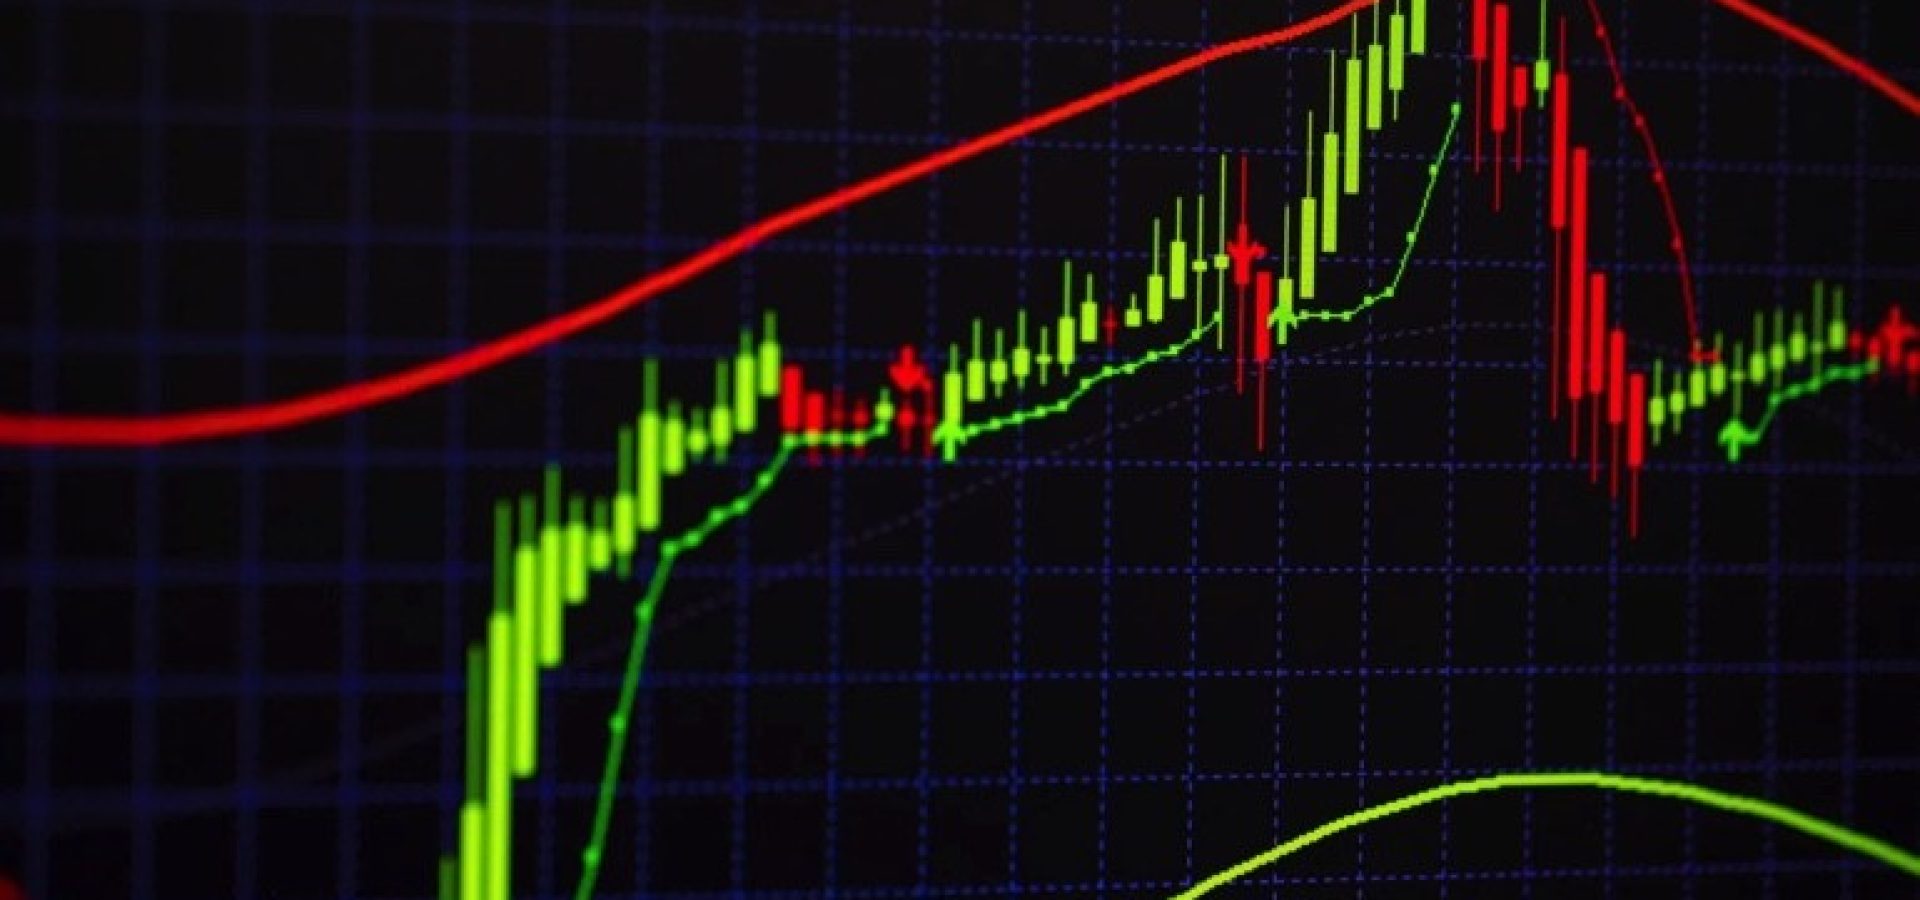
Moving averages are a standard method for technical traders to start the price analysis process. It is usually one of the indicators that traders first add to the chart and will use as a measure alone or compared with other indicators.
A moving average is the average price of a futures contract or stock over some time, such as ten days, 20 minutes, 30 weeks, or any period chosen by the trader.
Traders can add only one moving average or have many different time frames on a chart.
Types of moving averages
Moving averages can be calculated in different ways. The five-day simple moving average (SMA) adds the five most recent daily closing prices and divides them by five to create a new daily average. Each standard is connected to the next, forming a bizarre flow line.
Another popular moving average is the exponential moving average (EMA). The calculation is more complicated because it applies more weight to the most recent price. If you draw a 50-day SMA and a 50-day EMA on the same chart, you will notice that the EMA reacts to price changes faster than the SMA because the weight of the recent price data has increased.
Chart software and trading platform perform calculations, so manual mathematical calculations are not required to use moving averages.
Using Moving Averages
Generally, traders use moving averages to compare the relationship between the current price of the underlying instrument and the support and resistance levels on the chart. When the price drops to the moving average or rises to the moving average, traders can use it to signal that the price may stop or retrace at that point.
For example, if the price drops to the 200 EMA, a trader may think that the price may stop falling because the 200 EMA will support the price recovery.
Traders can also visualize short-term and long-term support and resistance on the chart by adding moving averages for different periods.
For example, a trader can use 13 EMA as a short-term indicator and 200 EMA as a long-term indicator on the same chart. The larger the EMA, the stronger the support and resistance, and the more likely the price will change direction when moving towards the EMA.
Traders may be particularly interested in moving average crossovers because these crossovers usually represent price changes. A cross occurs when a moving average crosses another, sending bullish and bearish signals.
A short-term moving average above the long-term moving average is usually considered bullish. In contrast, a long-term moving average below the short-term moving average is generally regarded as bearish.
For example, if a trader sees that the 50 EMA crosses the 200 EMA, this usually indicates that the price may continue to rise. Because of this crossover signal, traders who use moving averages to enter transactions may buy contracts or increase positions.
Moving averages are powerful and simple tools that help traders visualize current prices and where prices may move next.
The best moving average period for day trading
When you are a short-term day trader, you need a fast-moving average and react immediately to price changes. This is why it is usually best for day traders to stick to the EMA first.
When it comes to periods and lengths, you should generally consider three specific moving averages:
- Issue 9 or 10: Very popular and fast-growing. Usually used as a directional filter (more on this later)
- 21 period: the mid-term and the most accurate moving average. Good in terms of riding trends
- 50 period: long-term moving average, most suitable for determining the long-term direction
The best moving average period for swing trading
Swing traders have a very different approach. They usually trade in a higher time frame (4H, daily +) and hold longer trading hours. Therefore, swing traders should choose SMA first and use higher periodic moving averages to avoid noise and early signals. Here are four moving averages that are particularly important to swing traders:
- 20/21 period: In short-term swing trading, 21 moving average is my first choice. During the trend, the price respects it very much, marking a change in trend.
- 50 periods: The 50 moving average is a standard swing trading moving average, which is very popular. Most traders use it to navigate trends because it is an ideal compromise between short and long.
- 100 periods: There is something about whole numbers that will appeal to traders. When it comes to 100 moving averages, this is true. It is very effective for support and resistance-especially in the daily and weekly time frame
- 200/250 period: The same is true for the 200 moving average. The 250-period moving average is very popular on the daily chart because it describes the price trend of a year (about 250 trading days in a year)
Summing up
While all the trading indicators are super helpful while trading, the moving average is one of the major ones. Learn about it, follow the tips, and predict what might come up more accurately.
Interested in day trading while working? Check out the best broker for mobile traders of the year to try trading with.


COMMENTS