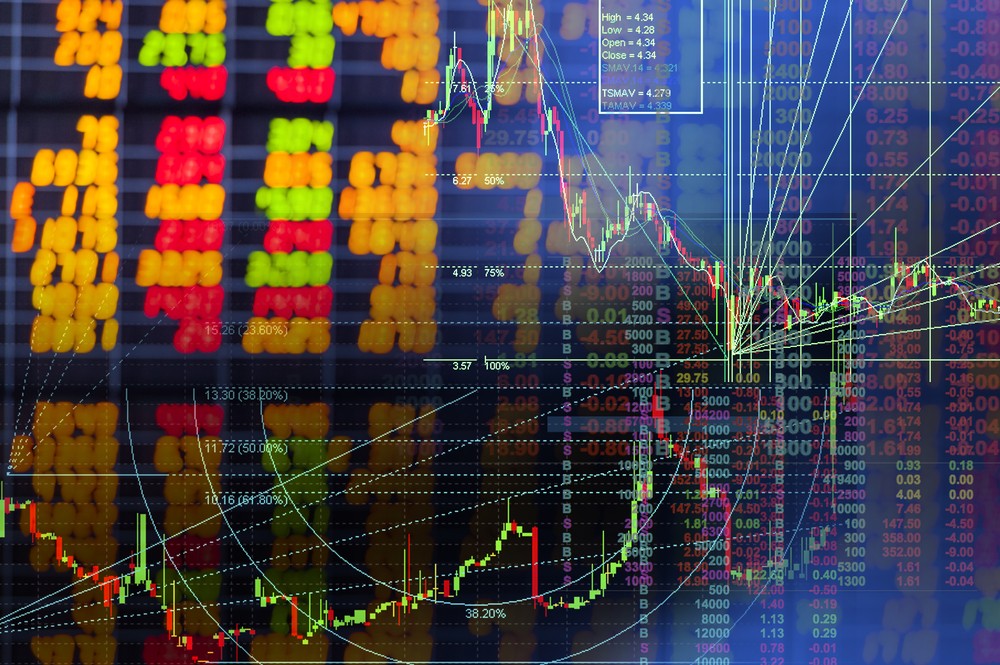
The technical analysis studies the historical behavior of a financial asset to predict future movements, using them for technical indicators and chart patterns.
The technical analysis of financial markets is a method to anticipate or forecast the direction that prices will take, based on the asset’s historical behavior. The analysis examines prices, time frames, traded volumes.
To carry out technical analysis, traders use technical, mathematical, statistical indicators, and graphical indicators. The conclusions obtained help them to make decisions about their positions in the stock market.
Technical analysis can be divided into two main groups:
Statistical analysis: It analyzes technical indicators generally calculated from mathematical formulas linked to stock market prices.
Graphical analysis: It is the analysis of price curves, looking for particular configurations.
Some traders specialize in only one of the two fields. Others use both.
Technical analysis tools
Therefore, technical analysis uses different tools to determine the probable course of prices.
Chartist figures
To carry out technical analysis, traders use tools such as horizontal lines, trend lines, and Fibonacci retracements to identify famous classic chart figures.
We find symmetric triangles and consolidation figures among them. These formations highlight the behavior of buyers and sellers in the market.
Japanese candles data
You can also analyze the Japanese candlesticks’ information to identify the opening, closing, high and low prices during a given period. Like chart figures, Japanese candles help identify buyers’ and sellers’ behavior over a short period.
Technical indicators
Finally, to complete their analysis, traders use technical indicators to understand market conditions and price trends better.
For example, many indicators serve to identify when a market is overbought or oversold. Other technical indicators provide clues as to whether the market will tend to be bullish or bearish.
The origins
Forex technical analysis has been around since the emergence of supply and demand-driven markets. The earliest known historical records date from around the 17th century of Dutch traders and the 18th century of Japanese rice traders.
In the late 1800s, technical analysis became popular with traders thanks to the founder and editor of The Wall Street Journal, Charles Dow.
Throughout history and for most of the 20th century, financial markets’ technical analysis was limited to chartism. It was not possible to perform statistical calculations with large amounts of information. However, we can say we are in the golden age of technical analysis.


COMMENTS