

Here are the latest market charts and analysis for today. Check them out and know what’s happening in the market today.
EURUSD
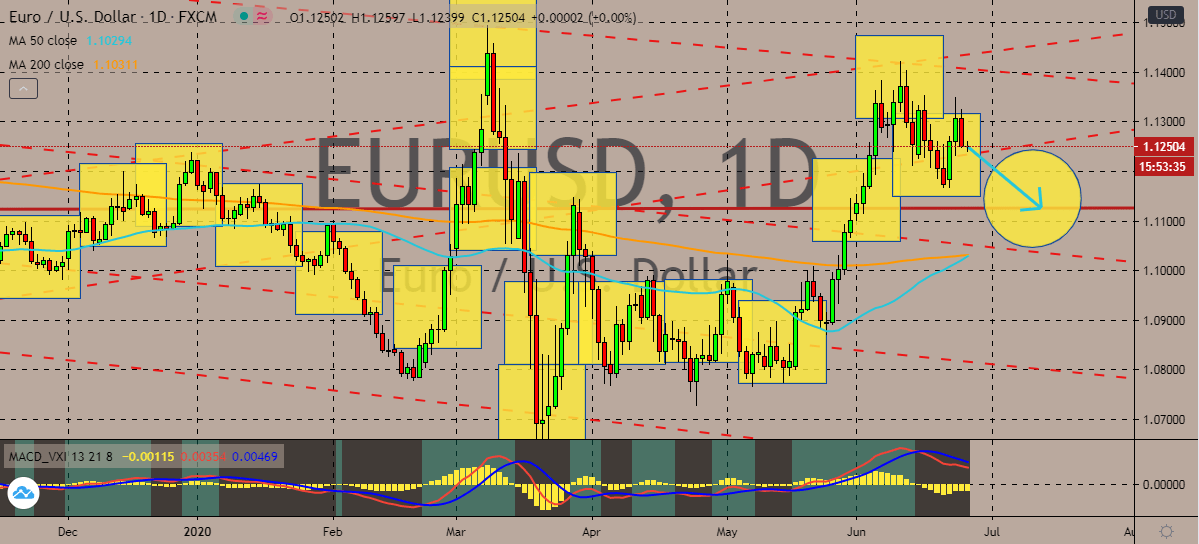
The euro to US dollar exchange rate is currently flirting with a critical support level this Thursday. The pair is struggling to break past it, fortunately enough for bearish investors, prices are projected to go down to its support level. If the pair goes down to its support, the 50-day moving average advancement towards the 200-day moving average should stop. The rising number of coronavirus cases in Europe is concerning investors, prompting them to gravitate towards the safe-haven currency, US dollar. The current landscape should work well for the greenback considering that the political tensions between the European Union and the United States continue to escalate. It was recently reported that the EU is looking to block travelers from America. The market has seen this coming considering that the US is greatly struggling to contain the widespread of the virus and still has the biggest number of confirmed cases as of writing.
USDJPY
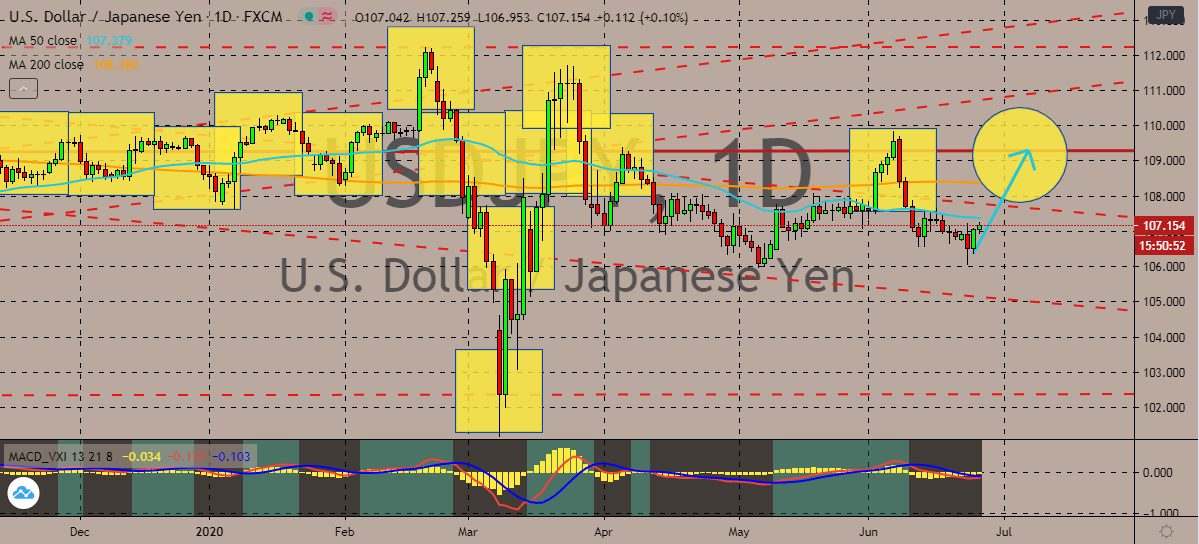
The US dollar to Japanese yen exchange rate is seen gradually gaining in the trading sessions. Bullish investors of the pair should continue its gradual climb towards its higher resistance level. The pair’s direction should slow down as it approaches the nearest resistance area, but it should continue its steady climb. Apparently, the greenback is struggling to push the 50-day moving average above the 200-day moving average, which is seen trading right above it. This means that bearish investors are still dominant in the sessions. Moreover, investors are focusing on the alarming number of new cases around the world, particularly in the United States. Lately, there has been a massive surge in hospitalizations in the state of California and Texas. Investors of the greenback are fearing that the United States will eventually be hailed as the epicenter for the coronavirus pandemic, a feat that will push the favor to bearish investors if it comes to reality.
EURAUD
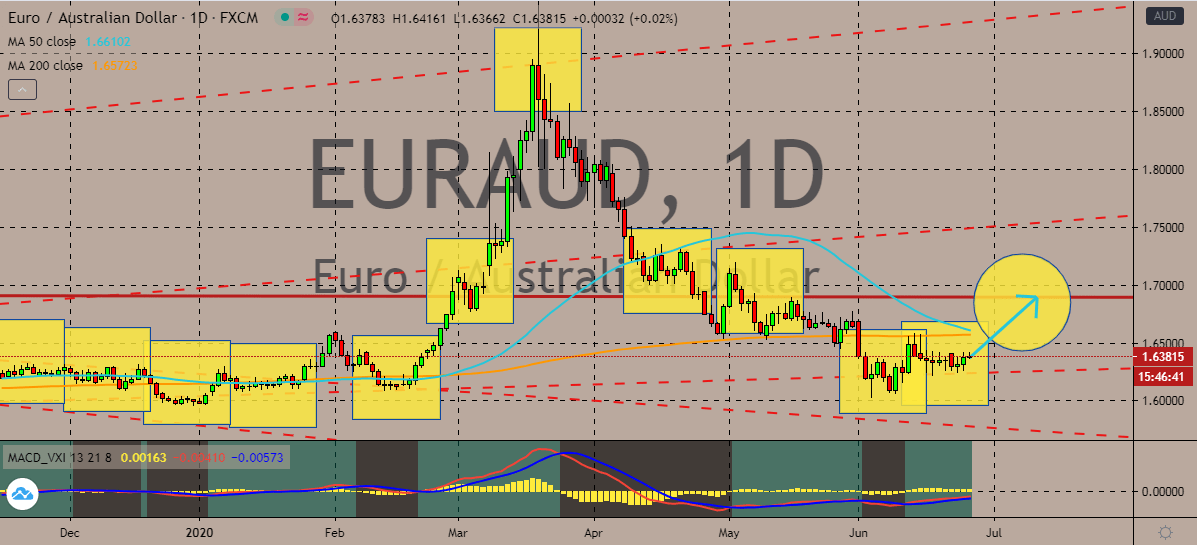
The EURAUD trading pair should see a gradual correction in the coming days. The exchange rate is projected to make a wide U-turn as the Australian dollar’s direction gets even more rougher, reaching its resistance level by the first few days of July. It’s widely believed that the Australian dollar is now showing signs of exhaustion based on its recent performances against most major currencies around the world. Looking at the charts, it appears that the pair is still considered bullish because the 50-day moving average is trading slightly higher than the 200-day moving average. If prices would climb to their resistance, bulls would be able to prevent the 50-day MA from falling further. The Australian dollar is feeling the pressure of the unfinished trade deal between the United States and China. Despite the slight hopes from the White House trade adviser, the deal is still not sealed and is still in danger as Trump’s national security advisor lashes against China.
GBPCHF
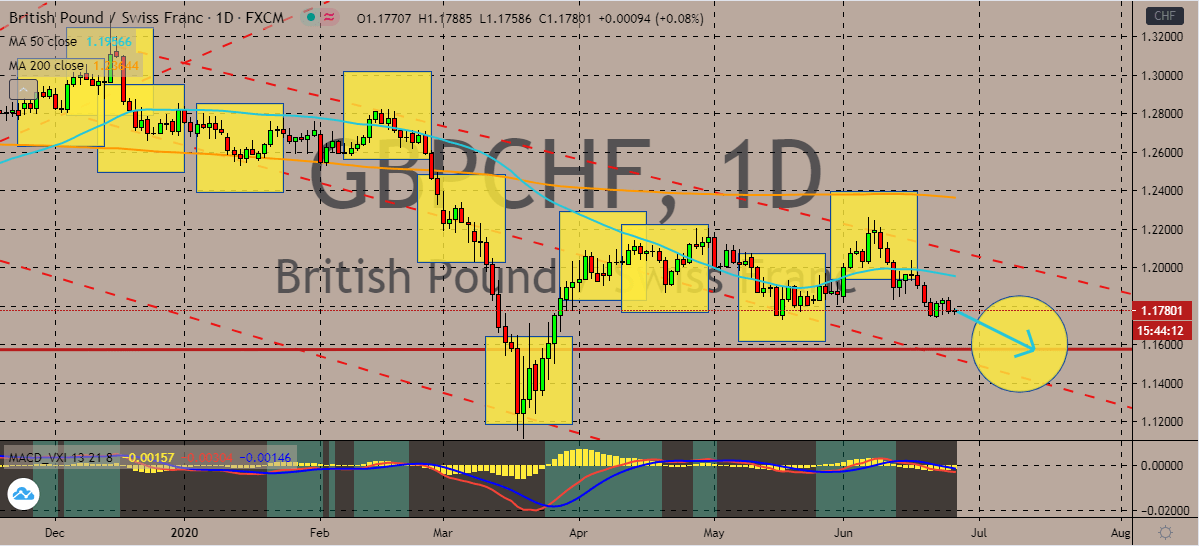
The Swiss franc takes the spotlight once against as the Swiss National Bank warns about its strength. Despite that, the pair is still projected to continue its downward trajectory. In fact, it appears that the safe-haven appeal of the currency is even pushing against the positivity of the British economy. Prices are very bearish considering that the 50-day moving average is significantly dominated by the 200-day moving average. Investors are still concerned by the recent comment of the Swiss National Bank saying that it will keep fighting to prevent the currency from continuously appreciating. However, it appears that the plan isn’t working that well as the trading pair continues to head down. On the other hand, the British pound took major blows in the previous days thanks to the risk-off sentiment in the market. The renewed concerns over the coronavirus pandemic are making it rough for the pound sterling to get back up to its feet.


COMMENTS