Here are the latest market charts and analysis for today. Check them out and know what’s happening to the market today.
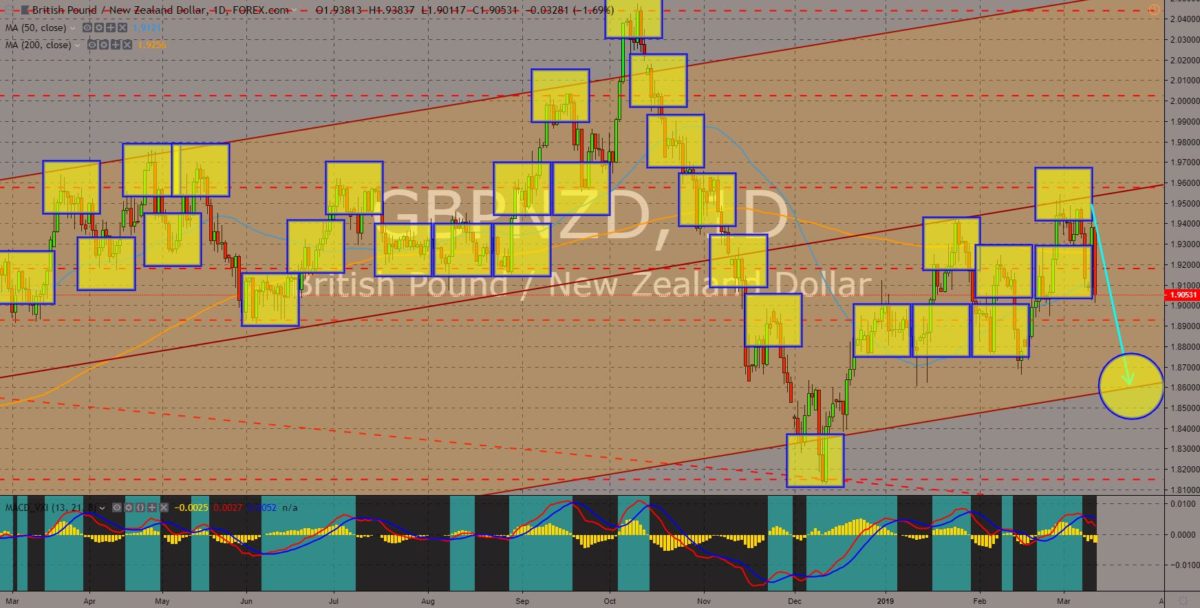
GBPNZD
The pair failed to break out of the middle resistance line of the uptrend channel, sending the pair lower to its support line. As the European Union and the United Kingdom took different paths with the UK’s withdrawal from the 27-nation bloc, the allies of the former 28-nation bloc need to take sides between the United Kingdom and the EU. New Zealand was the first county to express its intention of signing a post-Brexit trading agreement with the United Kingdom, despite having an existing trade relation with the European Union. The neutrality of New Zealand was its key to secure bilateral trade agreement with the UK and the EU. Its neighbor, Australia, did the same thing, but its trading relation with the European Union was not well received as the country was more inclined with the United Kingdom’s influence. Histogram and EMAs 13 and 21 recently crossed over, signaling a continued downward movement for the pair.

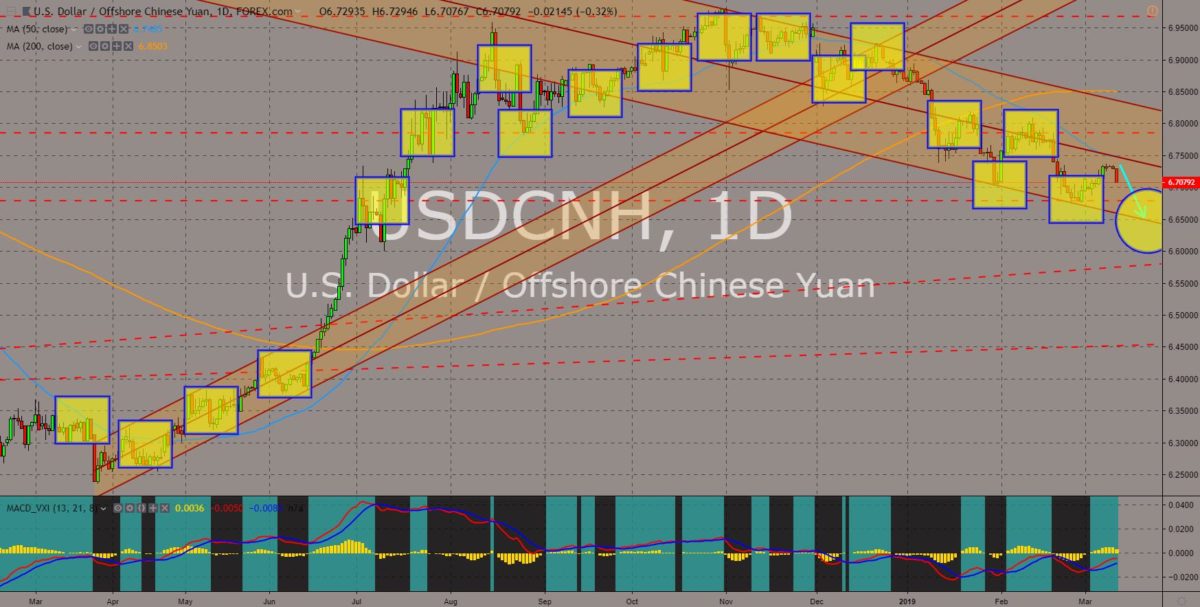
USDCNH
The pair will continue its steep decline after 50 MA and the downtrend channel middle resistance line stopped the pair from going up. The 90-day truce on the trade war between the United States and China expired last March 01. However, with the progress on the high-level talks between the two (2) countries continue to meet US President Donald Trump’s expectation, he extended the trade truce with no deadline announced. However, may US senators doubt that China will likely end its rivalry with the United States as China was set to overtake the United States as the largest economy in the world by 2025. The trade war also puts pressure on Trump who will seek to be re-elected on the 2020 US Presidential Election. Aside from winning the trade war against China, Trump also promised during the 2016 Presidential Election to build a wall on its border with Mexico, on which nothing had happened yet. Histogram and EMAs 13 and 21 will fall.

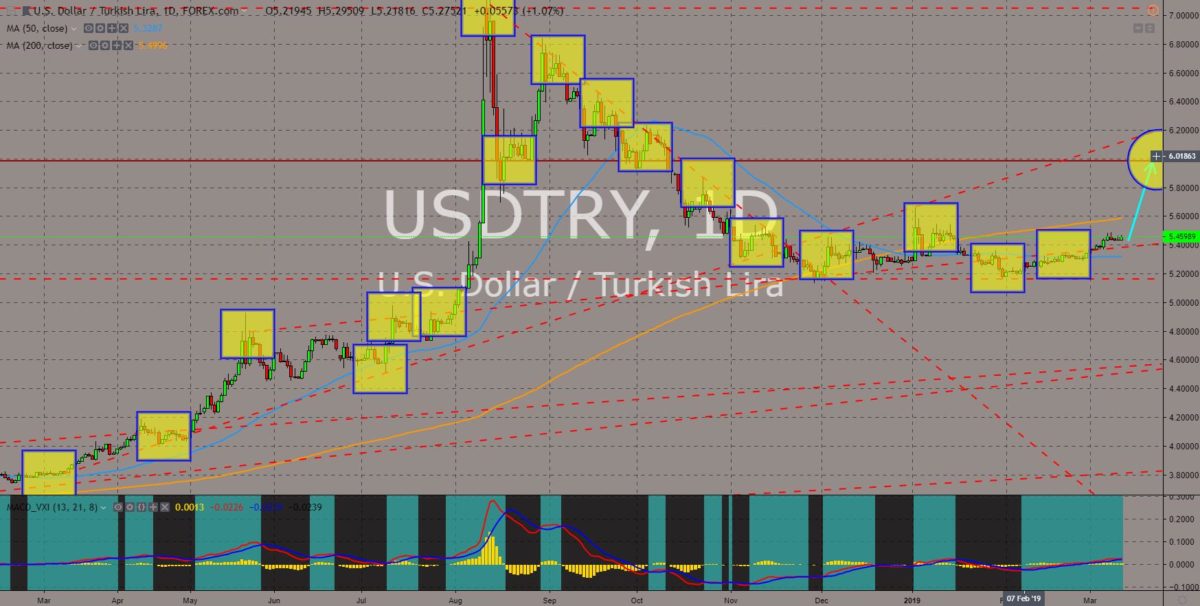
USDTRY
The pair was slowly consolidating upwards signaling a future rally, which will send the pair towards its 6-month high. The once luxurious geopolitical strategic country who gates the East and the West was now losing its limelight. For the first time in 10 years, Turkey entered a recession, and the people blamed Turkish President Recep Tayyip Erdogan for the turmoil. President Erdogan revised the Turkish constitution dissolving the Turkey’s parliamentary system and changed it to Presidential system. This allowed President Erdogan more power to sit people who are loyal to him on government institutions. Turkey had also threatened the West that it would side with Russia if its demand will not be given. However, the United States and the European Union found a way to counter Turkey by pressuring the country that they would withdraw selling military equipment for the country. Histogram and EMAs 13 and 21 will go up.

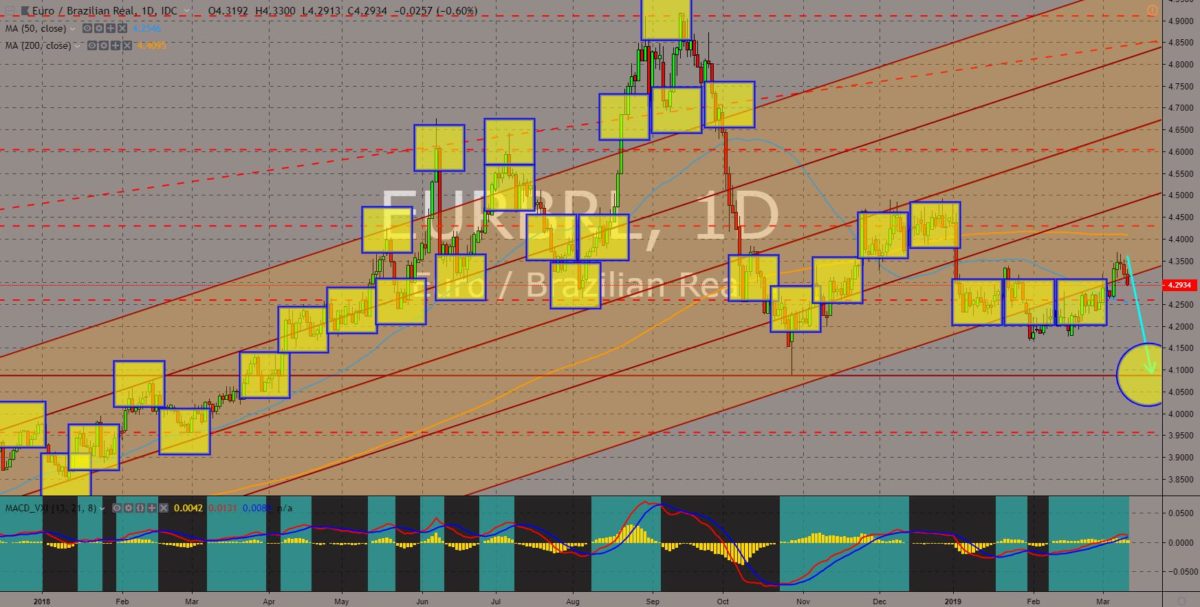
EURBRL
The pair was seen to break down from 50 MA after failing to bounce back from the last support line of the “Pitchfork Pattern”. The European Union was failing to strike a free trade agreement with the Mercosur, the largest trading bloc in South America, headed by Brazil. The European Union was increasing its effort to stop Brazil from looking like what US President Donald Trump had done to the United States, which was to pull out the country from major accords and pacts, with the new Brazilian President Jair Bolsonaro being dubbed as “South America’s Trump”. The European Union was also minimizing the possibility that Brazil might turn to Russia and China of the BRICS (Brazil-Russia-India-China-South Africa) and had lesser influence over the country. Histogram was slowly turning to the selling region, while EMAs 13 and 21 was expected to crossover in the following days.


COMMENTS